Business Compass End to End Use Case

Goal: To provide a detailed, hands-on onboarding and training scenario demonstrating the full functionality of the Business Compass platform. This use case enables new users, especially Business Analysts, to apply modeling, metadata management, opportunity analysis, and simulation to a realistic enterprise procurement process.

1. Business Case Identification

Author: Business Compass Analyst Team
Date: July 2025
Version: 1.0
Audience: Business Analysts, Process Owners, Transformation Teams

2. Scope and Level

Scope:
This use case covers the full life cycle of the Procure to Pay process, starting with a purchase request and ending with invoice payment and archiving of procurement documents. It has multiple functions: Procurement, Finance, Accounts Payable, and Vendor Management.

Level:
Level 3 (L3) End to end business process level with detailed subprocesses for modeling and simulation.

3. Actors

Primary Actors:

  • Employee (Requester): Initiates the purchase request
  • Buyer: Issues purchase orders and communicates with vendors
  • AP Analyst: Performs 3 way match and validates invoices
  • AP Manager: Approves invoice and oversees payment process

Supporting Actors

  • Line Manager: Approves purchase requests
  • Procurement Head: Oversees purchasing compliance
  • Vendor: Delivers goods or services and issues invoices
  • Receiving Clerk: Confirms receipt of goods
  • Treasury: Handles payments and cash management

4. Preconditions

System Access:
Users must have Editor level permissions in the Process and Opportunity modules of Business Compass

Knowledge Requirements:

  • Basic understanding of BPMN modeling and business process flows
  • Familiarity with procurement or finance operations is helpful but not mandatory

Preparation

  • Access to Business Compass Excel Import Template
  • Reference architecture with SAP or similar systems documented
  • Folder structure prepared in the Business Compass workspace

Procure to Pay (P2P) Process Modeling

Open the Process Modeler

Let’s start by heading to the Business Process Center.
From your main dashboard or workspace, click on Process Center in the left-side menu.

This is where you’ll create and manage all your process models.

Click on New → Create Process to get started.

Create the Process

A modal will pop up asking for some basic info.

Let’s fill that in:

  • Process Name: Procure to Pay (P2P)
  • Description: “Full procurement cycle from request to payment.”
  • Owner: Procurement Manager
  • Choose a folder where this process should live.

Then click Create. This will open up the process canvas in modeler view.

Set Up Your Swimlanes

Before we add any steps, let’s organize the layout.

Use the + Pool/Lane tool to add swimlanes for each participant in the process.
For P2P, we’ll need these roles:

  • Employee (Requester)
  • Line Manager
  • Buyer
  • Vendor
  • Receiving Clerk
  • AP Analyst
  • AP Manager
  • Treasury

Now we’re ready to start building the process itself.

Map Out the Core Flow

Using the left-side BPMN tools, drag a Start Event into the Employee lane.
Then begin adding the main flow steps in this order:

  1. Request Purchase
  2. Manager Approval – follow this with a gateway labeled “Approved?”
  3. If Yes → Create Purchase Order
  4. Send PO to Vendor
  5. Receive Goods/Services
  6. Perform 3-Way Match – add a second gateway here for “Match OK?”
  7. If Match passes → Approve Invoice for Payment
  8. Issue Payment
  9. Archive & Close PO
  10. Add an End Event to close the flow

Make sure each activity is in the right swimlane. You can use connectors to join each step.

Don’t worry about making it perfect—just focus on capturing the main steps for now.

Add Metadata to Activities

Now click on each activity in your flow one by one.

When the activity panel opens on the right side, you’ll start adding the following details:

  • RACI (Responsible, Accountable, Consulted, Informed)
  • System (e.g., SAP, Email, ERP)
  • Work Time (e.g., 30 minutes)
  • Cost per Run (e.g., $25)
  • Value Added (Yes / No / Mandatory)

Use the metadata table from the P2P section above if you need examples.

Pro tip: You can always switch to Overlay View to visually confirm where metadata is missing.

Check Gateway Logic

Let’s make sure the gateways are configured properly.

Click on the Manager Approval gateway.
You’ll see a branch probability setting.

Set it to:

  • Yes → 85%
  • No → 15%

Now do the same for the Match OK? gateway:

  • Match Success → 90%
  • Exception → 10%

Gateways are what drive conditional flow in simulations—so getting this right matters.

Review with Overlay View

Almost there! Click the Overlay View toggle in the top-right corner of the modeler.

This lets you check the entire diagram for gaps.

Use the dropdown to toggle between:

  • Responsible roles
  • Systems
  • Time
  • Cost
  • Value Added

If anything is missing, click the activity and fill it in.

Link an Opportunity

Let’s say we want to automate the 3-Way Match.

Click on the 3-Way Match activity in the AP Analyst lane.
In the right-side panel, scroll down to the Opportunities section.
Click Link Opportunity → Create New.

Add the following:

  • Title: Automate 3-Way Match
  • Tags: Automation, Invoice
  • Feasibility: High
  • Strategic Impact: 5
  • ROI Estimate: $70,000 annually

Click Save. Now this opportunity is directly tied to the activity in your model.

Simulation Parameters

Now we’ll walk through how to run a simulation for the Procure to Pay (P2P) process.

Access the Simulation Module

First, navigate to the Simulation module in the tool.

  • This is where you can create, manage, and run simulations.
  • Click on "Simulation" from the main menu or dashboard to get starte
Add Basic Information

Once you're in the simulation module:

  1. Click on “Create New Simulation.”
  2. Enter the Simulation Name—e.g.,⁣. P2P.
  3. Enter a description—for our case we will add a short description, "Automate process" to indicate this simulation is meant to evaluate automation opportunities
Define Simulation Scenarios

Now you’ll select the two processes to simulate and compare:

  • First Process to Simulate:
    Select the current Procure To Pay process. This will serve as the baseline or “as-is” version.
  • Second Process to Simulate:
    Upload the same Procure To Pay process again. After uploading, you’ll modify it directly in the simulation

Important: Any changes you make to the process in the simulation only live in the simulation. If you want to permanently store a modified version of the process (e.g., your automated "to-be" model), you'll need to first create or update that model in the process modeling tool and then upload it separately into the simulation.

To create a realistic simulation, we’ll now define the key input parameters. These inputs determine how each activity behaves during the simulation. Configuration includes activity durations, decision logic, resource usage, and costs.

Simulation setup inputs include:

  • Activity-Level Parameters
  • Gateway Parameters
  • Resource Parameters
  • Process-Level Parameters
Activity-Level Parameters

These define how each task operates during the simulation. You can configure them by:

  • Clicking directly on an activity in the process diagram
  • Or using the configuration table below the diagram.

Here are the key parameters:

  • Work Time (Duration + Deviation):
    Specify how long the task takes, including a deviation value to account for variability.
    (e.g., 10 minutes ± 2 minutes)
  • Manual vs. Automatic Activity Type:
    Mark activities as either manual (performed by people) or automatic (system-executed).
    Automatic tasks do not consume human resource capacity.
  • Cost per Activity:
    Enter a fixed cost incurred each time the activity runs.
    This can reflect system or operational overhead — excluding labor cost.
  • Participants (Performers):
    Defined by lanes in the BPMN model. This is not changed in the simulation pane.
    To change this, use the Edit Modal (top-right of the screen).
Gateway Parameters

Gateways define decision logic that impacts which path the process takes. You’ll set this up in both scenarios, but with optimized paths in the to-be process if relevant.

  • Branch Probability:
    For exclusive or inclusive gateways, set the percentage likelihood of each path being taken.
    All paths from the gateway must add up to 100%.

Let’s go back to our case.

After selecting the two versions of the Procure to Pay (P2P) process, the next step is to configure each scenario to reflect real-world behavior and potential improvements.

What We’re Going to Do:

  • For both scenarios, we’ll update the gateway parameters to define how decisions are made within the process. This includes setting the probability of each path being taken to accurately represent current and future workflows.

To represent automation in the to-be version, we’ll make the following specific changes to one activity:

  • Change Task Type: Convert the selected activity from manual to Automatic, meaning it no longer requires a human resource to execute.
  • Reduce Work Time: Decrease the duration from 1 hour to just 5 minutes, simulating the efficiency of automation.
  • Reduce Cost: Set the Cost per Activity to 0, reflecting that automated tasks do not carry the same execution overhead as manual tasks.

Remember: These changes are made within the simulation only. They don’t modify the original process model.
If you want to preserve these changes permanently, you must update the process in the modeling tool and re-upload it to the simulation environment.

Now that we've configured task behavior and decision logic, the next step is to define resource parameters—who (or what) is doing the work in your simulation.

Resource settings help simulate staffing levels, system capacity, labor costs, and overall efficiency. They also help identify potential bottlenecks or overutilized workers.

Resource Parameters

These parameters define how tasks are executed by either human workers or automated systems and how that impacts cost, utilization, and scheduling.

Key Resource Settings:

  • System vs. Human:
    • If a swimlane is designated as a system, all tasks within that lane are considered fully automated.
    • System swimlanes do not use human resource schedules and have their own utilization logic.
  • Worker Team Size / Number of Workers:
    • Sets how many workers are available for a given role.
  • Hourly Rate:
    • Used to calculate labor costs. You can configure the rate per hour, day, week, month, or year depending on how you track compensation.
  • Check Interval:
    • Minimum wait time (at least 2 minutes) before a worker checks for a new task.
    • This setting affects idle time and can have a deviation to reflect real-world variability.
  • Schedules:
    • Manual resources require defined schedules (e.g., working hours, days).
    • System resources do not require schedules and operate continuously.
For Our Case

In the to-be scenario, we are simulating automation improvements. As part of this:

  • We will convert three existing human resource swimlanes into system swimlanes.
  • This means:
    • Tasks in these swimlanes will be treated as automated.
    • No manual labor cost will apply.
    • No schedules will be required.
    • This will significantly improve resource availability and reduce process cost and time.

Now let’s complete our setup with one final and critical step — defining the Simulation Options. These process-level parameters control how, when, and how much work flows through your process model during the simulation run.

Think of this step as translating your real-world operational conditions — such as workload volume, task arrival frequency, and simulation duration — into the simulation engine’s rules. These settings shape the behavior of your entire process over time, determining the rhythm and intensity of incoming cases and providing the context for measuring performance under realistic or hypothetical conditions.

This is where your simulation becomes truly meaningful — by mirroring actual business dynamics and allowing you to test improvements with confidence.

Simulation Results

Scenario Impact Analysis: Measurable Results

After running the simulation, here’s how the to-be process outperformed the current one:

Time Savings
  • Avg Queue Time Cut: 2 weeks saved (↓48%)
  • Avg Work Time Saved: 55 minutes per instance (↓18%)
  • Cycle Time Cut: 2 weeks faster on average (↓47%)
  • Calendar Time Saved: 4 months saved end-to-end (↓45%)

Efficiency Boost

  • Overall Efficiency increased by 56%, meaning less idle time and better resource usage.
Cost Savings
  • Total Process Cost Saved: $43,700 (↓21%)
  • Per-Instance Cost Cut: $43.70
  • Annualized Benefit: $62,299.36 — if run at current volume over a full year
Simulation Result

Conclusion: Why This Matters

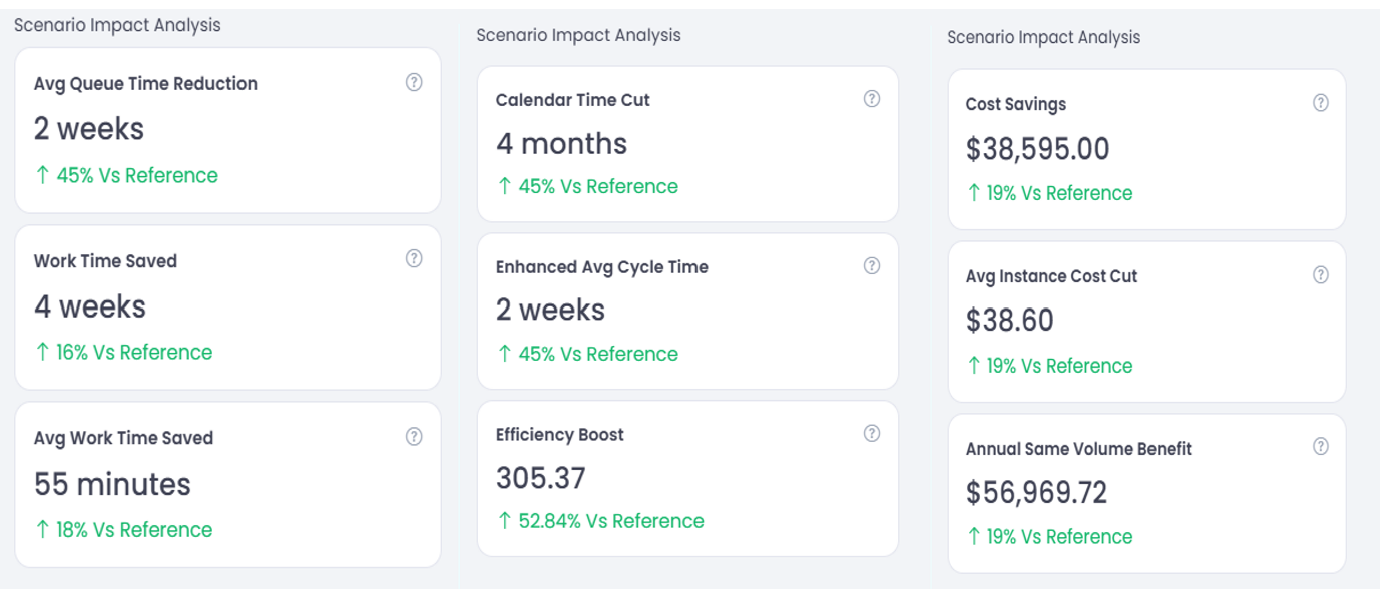
This simulation exercise demonstrates how thoughtful improvements — such as automation and resource optimization — can result in:

  • Lower costs
  • Faster execution
  • Higher resource efficiency

ROI Wizard

Step 1: Launch the ROI Wizard

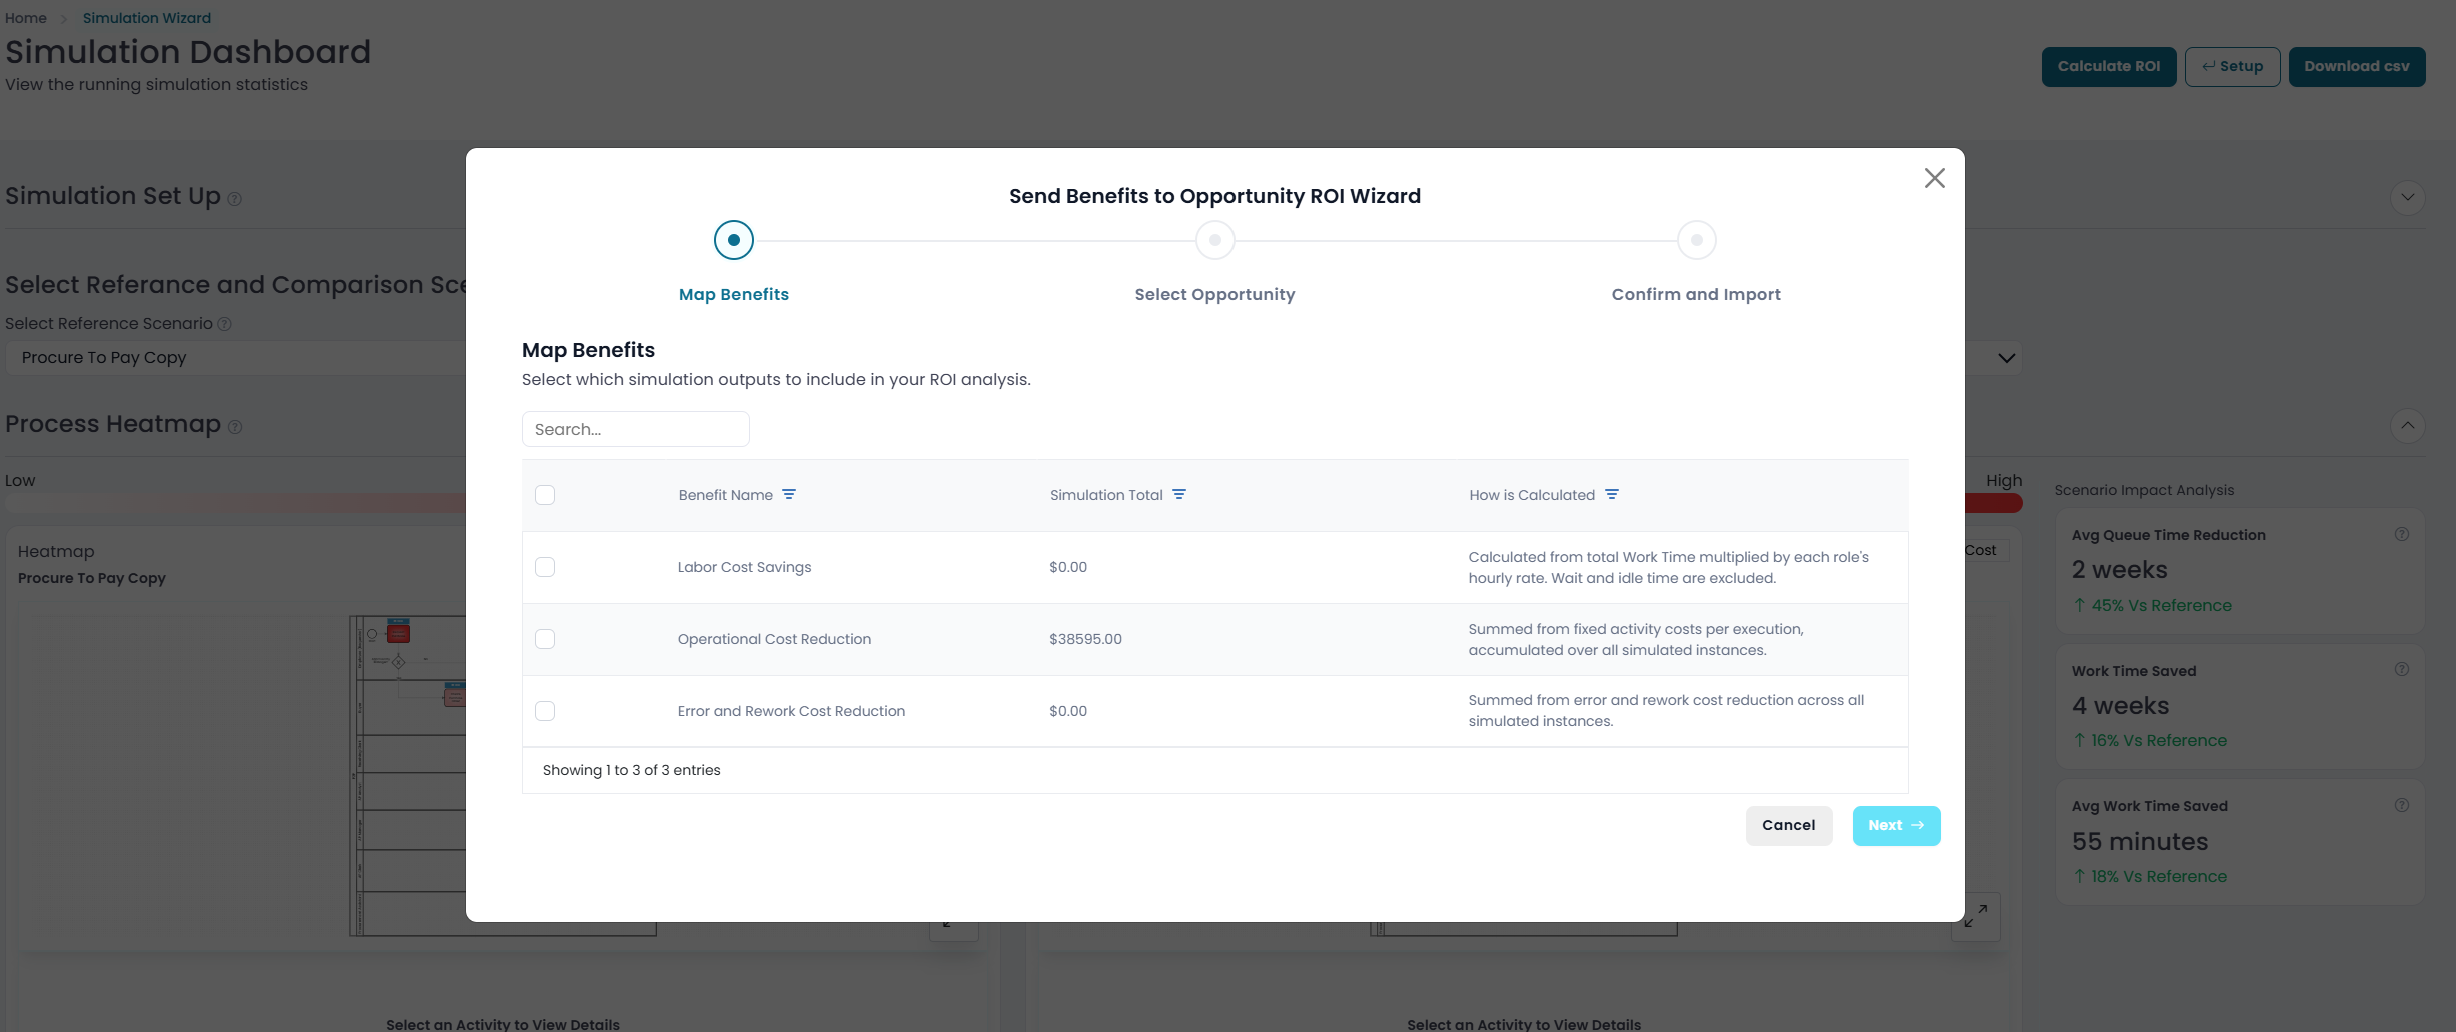
You are in the "Send Benefits to Opportunity ROI Wizard" tool, which helps you calculate the Return on Investment (ROI) based on simulation results.

Step 2: Enter the "Map Benefits" Stage

This is the first step of the wizard. You are asked to select which simulation outputs (benefits) you want to include in your ROI analysis.

Step 3: Review the Benefit Options

You’re shown a table with three columns:

  • Benefit Name: What kind of savings or improvement this is.
  • Simulation Total: The total amount of savings this simulation calculated for that benefit.
  • How is Calculated: Explanation of how that benefit was calculated.

For our case we are going to select Operational Cost Reduction

Opportunity ROI Wizard
Step 4: Confirm the Destination (Pre-selected)

  • The option "Create New Opportunity" is selected by default — no action is needed unless you have another destination option available.
Step 5: Enter Opportunity Name

Type in a name for your opportunity (this is a required field).

  • Example: "Automate 3 way match"
  • This name will label the ROI analysis you're creating.
Step 6: Select Time Units

  • Choose how ROI should be measured:
    • Monthly (selected by default)
    • Yearly
  • The time unit determines how the benefits will be distributed across the periods you set.
Step 7: Set ROI Time Frame

  • Start Date: Pre-filled with actual analysis month (you can change this).
  • Number of periods: Currently set to 1 (i.e., 12 month).
    • You can increase this to estimate ROI over multiple months or years, depending on your analysis needs.
Opportunity ROI Wizard
Step 8: Confirm and Import

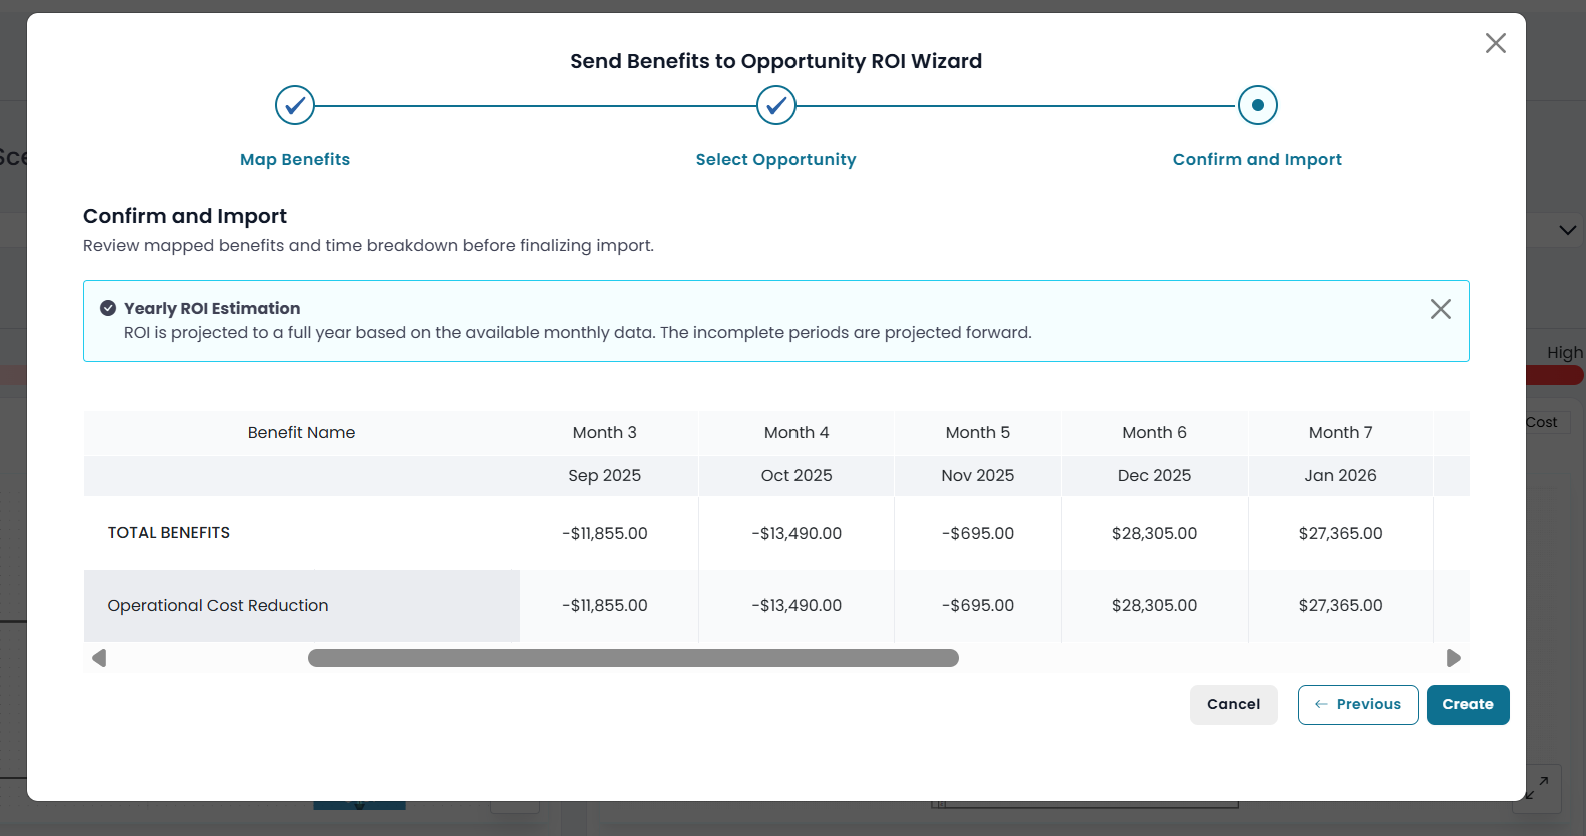
Finally, you can confirm and import the results. The table provides a monthly breakdown of the Operational Cost Reduction benefit projected over part of the year.

For our case:

1. Initial Months Show Negative ROI

  • September 2025: –$11,855.00
  • October 2025: –$13,490.00
  • November 2025: –$695.00

These months reflect cost increases or losses rather than savings, indicating that the operational changes may initially introduce higher costs — likely due to:

  • Implementation/setup efforts
  • Transition inefficiencies
  • Front-loaded costs
2. Later Months Deliver Strong Positive ROI

  • December 2025: $28,305.00
  • January 2026: $27,365.00

These months show substantial savings, suggesting that once the new process stabilizes, the organization starts to realize significant cost reductions.

Despite early losses, the simulation projects strong ROI in the later months, indicating that the initiative may require an upfront investment but becomes financially beneficial over time. It's a classic ROI ramp-up curve — short-term cost for long-term gain. Let's create our opportunity.

Opportunity ROI Wizard

Opportunity

Stop Guessing.
Start Knowing.

Every day you wait is another day that six-figure savings stay hidden in your processes. Take the first step.