Understanding the Process Module

This tutorial provides step-by-step guidance for using the Process Module in Business Compass. You'll learn how to model, document, analyze, and link improvement opportunities through this module. In this tutorial, you will learn how to:

  • Build and manage process models in BPMN format
  • Navigate folders, workspaces, and the Process Center interface
  • Apply and edit metadata at the process and activity level
  • Classify metadata as searchable or non-searchable
  • Use Overlay View to visualize data on diagrams
  • Import metadata using the Excel Mapping Wizard
  • Understand metadata aggregation at multiple levels
  • Integrate opportunities from within the process
  • Control access and permissions for users and editors
  • Import/export process data and structure for collaboration

1. Overview

The Process Module is your workspace for designing and improving business operations through visual modeling and rich metadata. This tutorial uses the Procure to Pay (P2P) use case as a baseline for training.

2. Access and Permissions

Procedure

  • Editors can create, edit, and delete processes
  • Viewers can explore but not modify content
  • Permissions are managed by:
    • Module access
    • Feature license
    • Folder-level controls
    • Account activation

Result: Proper access ensures secure, role-based collaboration.

3. General Navigation

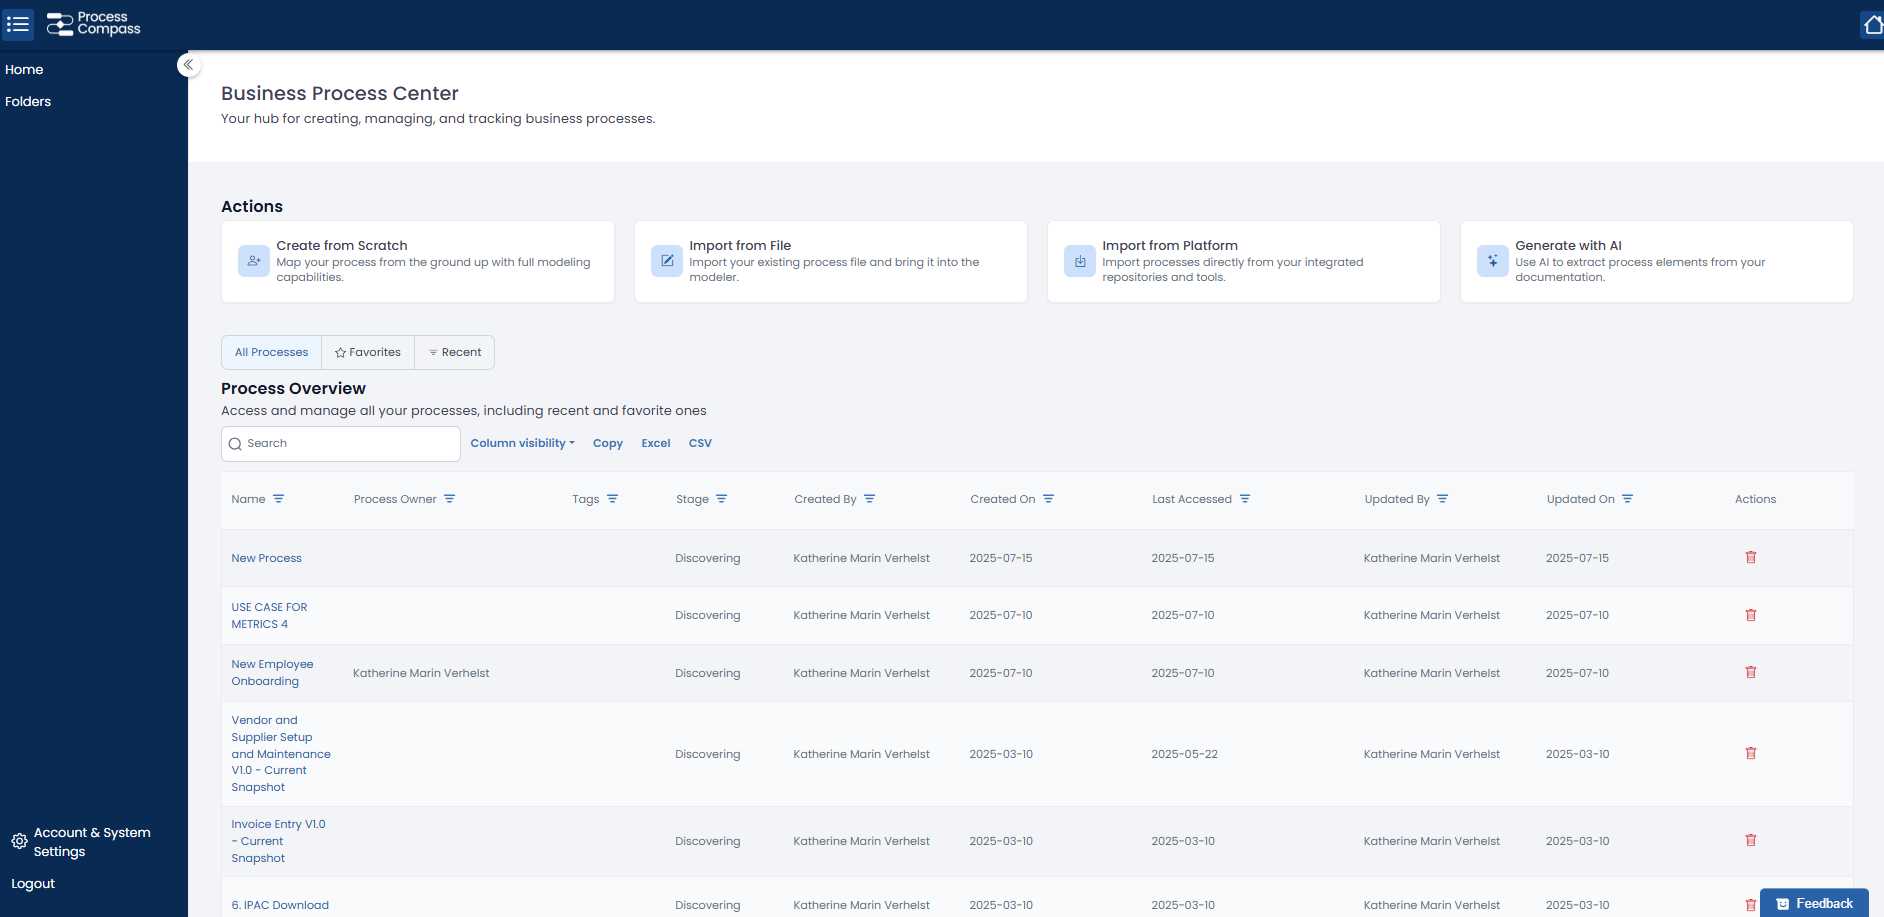
Left panel: Navigate folders, Account & systems settings and logout

  • Center panel: View actions cards, process overview table
  • Right panel: View aggregated metadata summaries (Only when you have a process open)
  • Top bar in the table: Search, filter, favorites, recent, export to excel or csv and sort processes

Result: You easily move through your workspace and find the content you need.

General View of the Business Process Center

4. Building & Managing Processes

  1. In the Business Process Center Overview, go to actions and click on Create from Scratch.
  2. Automatically Business Compass will open the BPMN modeler and you can start building your model.
  3. Name your process (e.g., “Procure to Pay”) and add other relevant information like Process Owner or tags.
  4. Add the different BPMN elements, pool, start events, activitis, gateways, subprocesses, swimlanes, etc.
  5. Click on Save or Save and Close, before closing or move to another window.
  6. Go to the left panel and click on Folders. Based on your folder structure or process architecture, move processes across folders or restructure the hierarchy.

Result: A fully modeled process that reflects business operations, organized for analysis and collaboration.

5. Process-Level Details

  • Click on a process
  • Edit details: Name, Scope, Description, Objectives, Owner
  • System auto-fills Created Date and Author

Result: Your process includes contextual information and ownership for governance.

5.1 Activity-Level Details

  • Click any activity in your BPMN diagram
  • Add RACI roles, timing, value added, cost, inputs/outputs, systems

Result: You document each task in operational terms, preparing it for analysis or automation.

5.2 Metadata Classification and Usage

  • Metadata is divided into two types:

5.2.1 Non-Searchable Properties

  • Work Time, Wait Time, Due After
  • Costs (Name, Currency, Frequency)
  • These are viewable but not used in filters or dashboards

5.2.2 Searchable Properties

  • RACI Roles, Systems, Assets, Supplier/Customer
  • Inputs/Outputs, SIPOC, Value Added
  • Searchable and aggregated across the platform

Result: You understand how metadata drives filtering, reporting, and aggregation.

5.2.3 Editing and Viewing Metadata

  • Editors can view and edit metadata on any activity or process
  • Viewers only see filled fields (blank fields hidden)
  • Always click Save after editing

Result: Clean metadata entry and governance is ensured across contributors.

6. Overlay View: Visual Insight Tool

6.1 How it Works

  • Toggle Overlay View in the BPMN canvas
  • Choose metadata types to visualize

6.2 Interactive Features

  • Use color codes, icons, and tooltips
  • Highlight specific metadata patterns and gaps

Result: Visual review reveals process inefficiencies and role/system concentration.

Stop Guessing.
Start Knowing.

Every day you wait is another day that six-figure savings stay hidden in your processes. Take the first step.