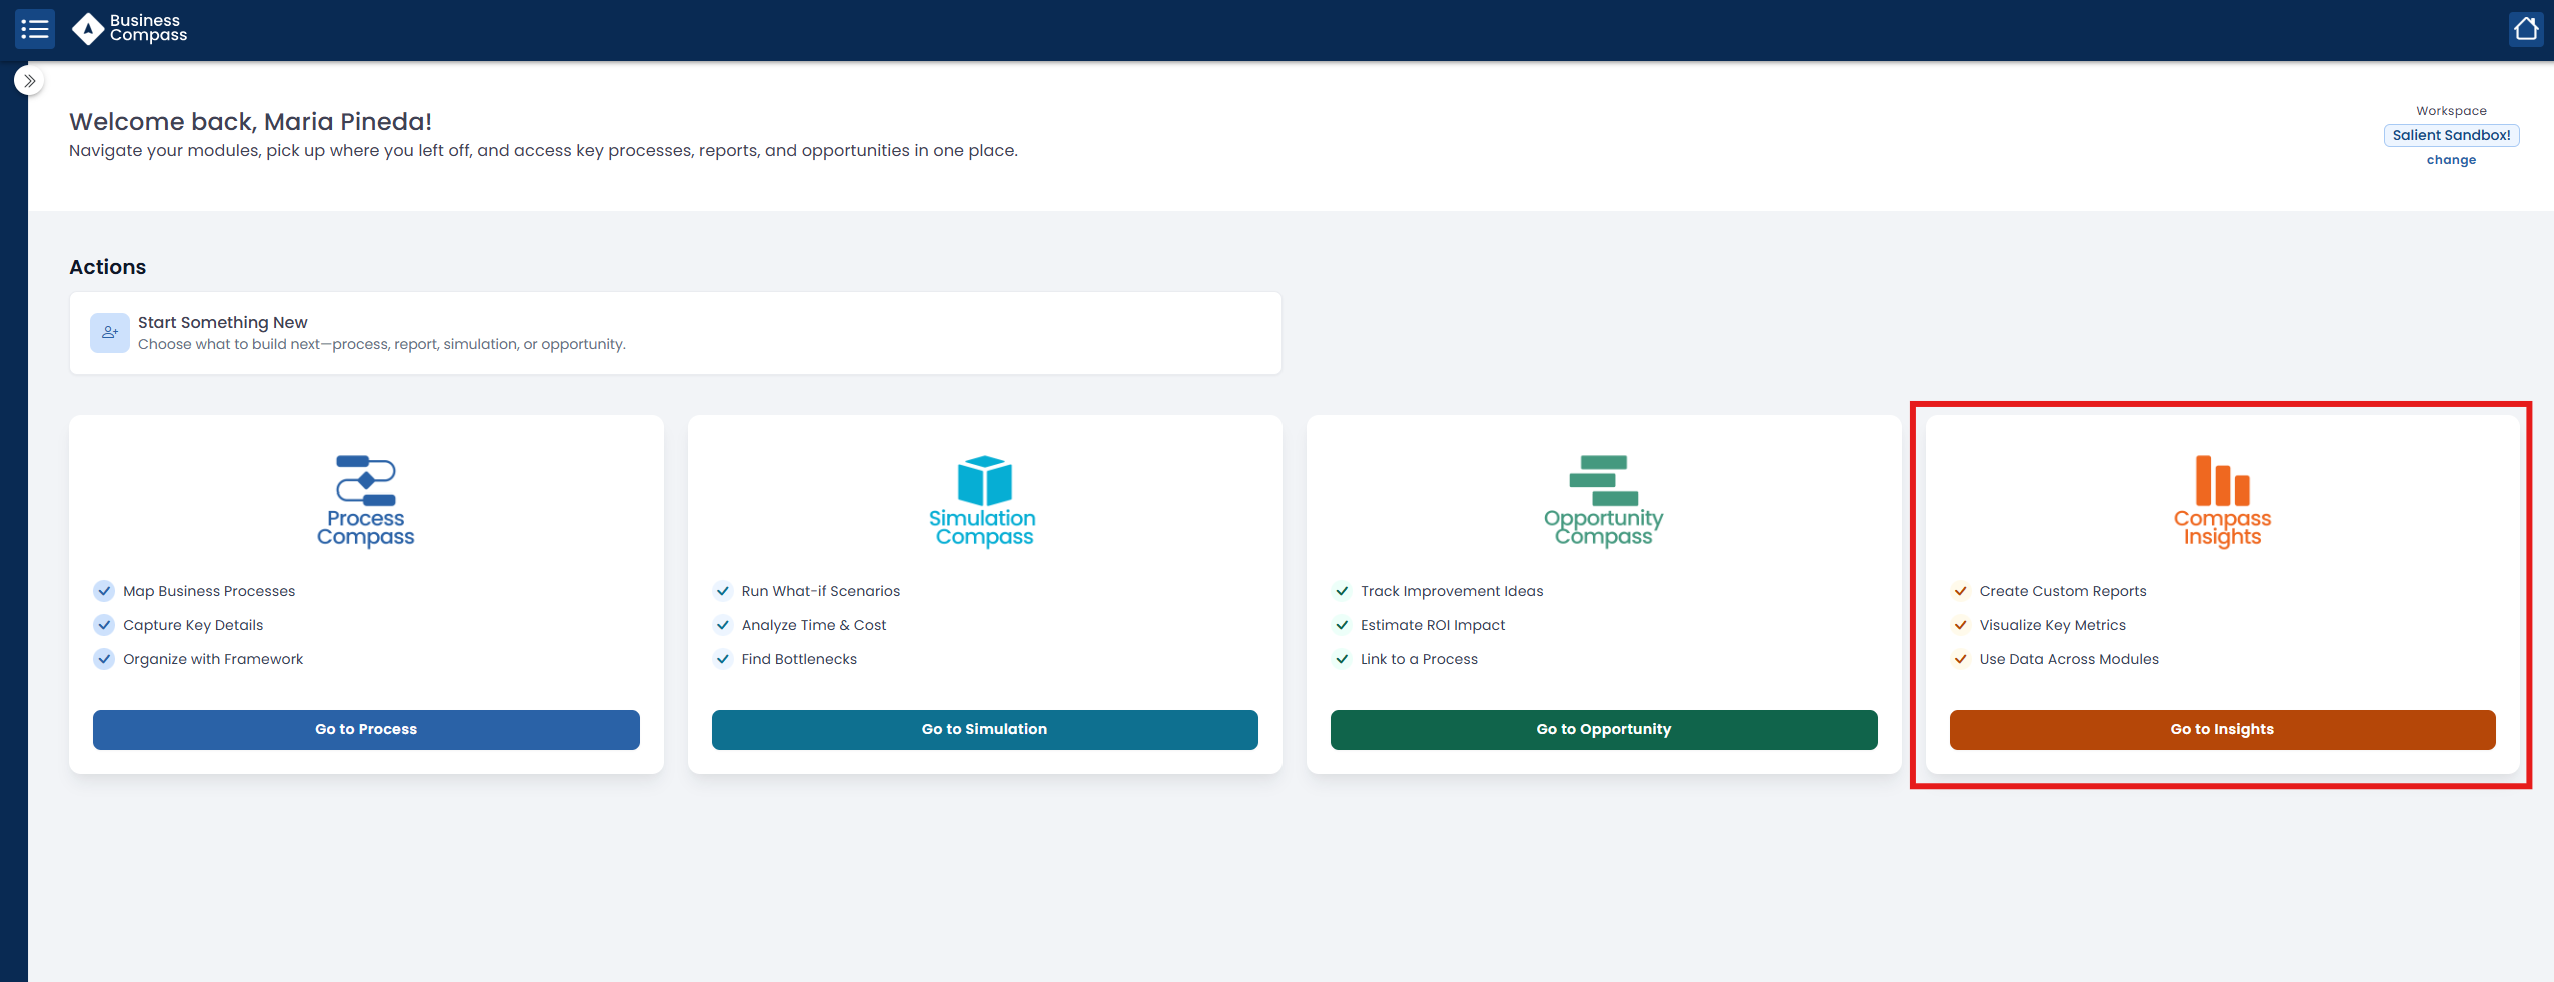
Enables users to create personalized, data-rich reports by accessing information across all Business Compass modules. Users can visualize key metrics using various reports. With real-time data updates, the module ensures accurate insights. simplifies decision-making without requiring technical expertise.
Insights Module
2. Getting started
2.1 Access the "Create New Report" Option:
On the main Insights Hub screen, locate the "Actions" section.
Click on the "Create New Report" option, typically accompanied by a pencil icon. This will open the "Create New Report" dialog box
2.2 Fill in Report Details
Report Name: In the "Report Name" field, enter a descriptive name for your new report. (e.g., "Monthly Sales Performance," "Customer Demographics Report")
Type: From the "Type" dropdown menu, select the desired report type. In the provided image, "Pivot Table" is the default option.
Tags: (Optional) In the "Tags" field, you can add new tags or select existing tags to help organize and categorize your reports.This can be useful for filtering and searching later.
Once you have filled in all the necessary details, click the Next button to create your new report.
2.3 Select Processes
Select the specific data or processes you want to include in your report.Once you select the reports you want to include, Insights Compass will generate a pivot table to help you begin your analysis.
Key Report Management Actions
Manage Data Set: Click the "Manage Data Set" button to modify the data included in your report. This will likely take you back to a screen similar to the "Create New Report" data selection step.
Export: Use the "Export" button to export your report in various formats (e.g., CSV, Excel, PDF).
Refresh: Click "Refresh" to update the report with the latest data.
Stop Guessing. Start Knowing.
Every day you wait is another day that six-figure savings stay hidden in your processes. Take the first step.