Simulating a process allows us to recreate a real-world workflow in a controlled environment so we can observe its behavior, test improvements, and predict outcomes without disrupting actual operations. In this guide, we’ll walk through the steps to set up and run a simulation using the Business Compass Simulation Module.
Part 1—Create Your Baseline Scenario Before you begin, ensure the process you want to simulate is already created in the Process Module—the simulation depends on this.
Use this 4-step flow each time you run a simulation:
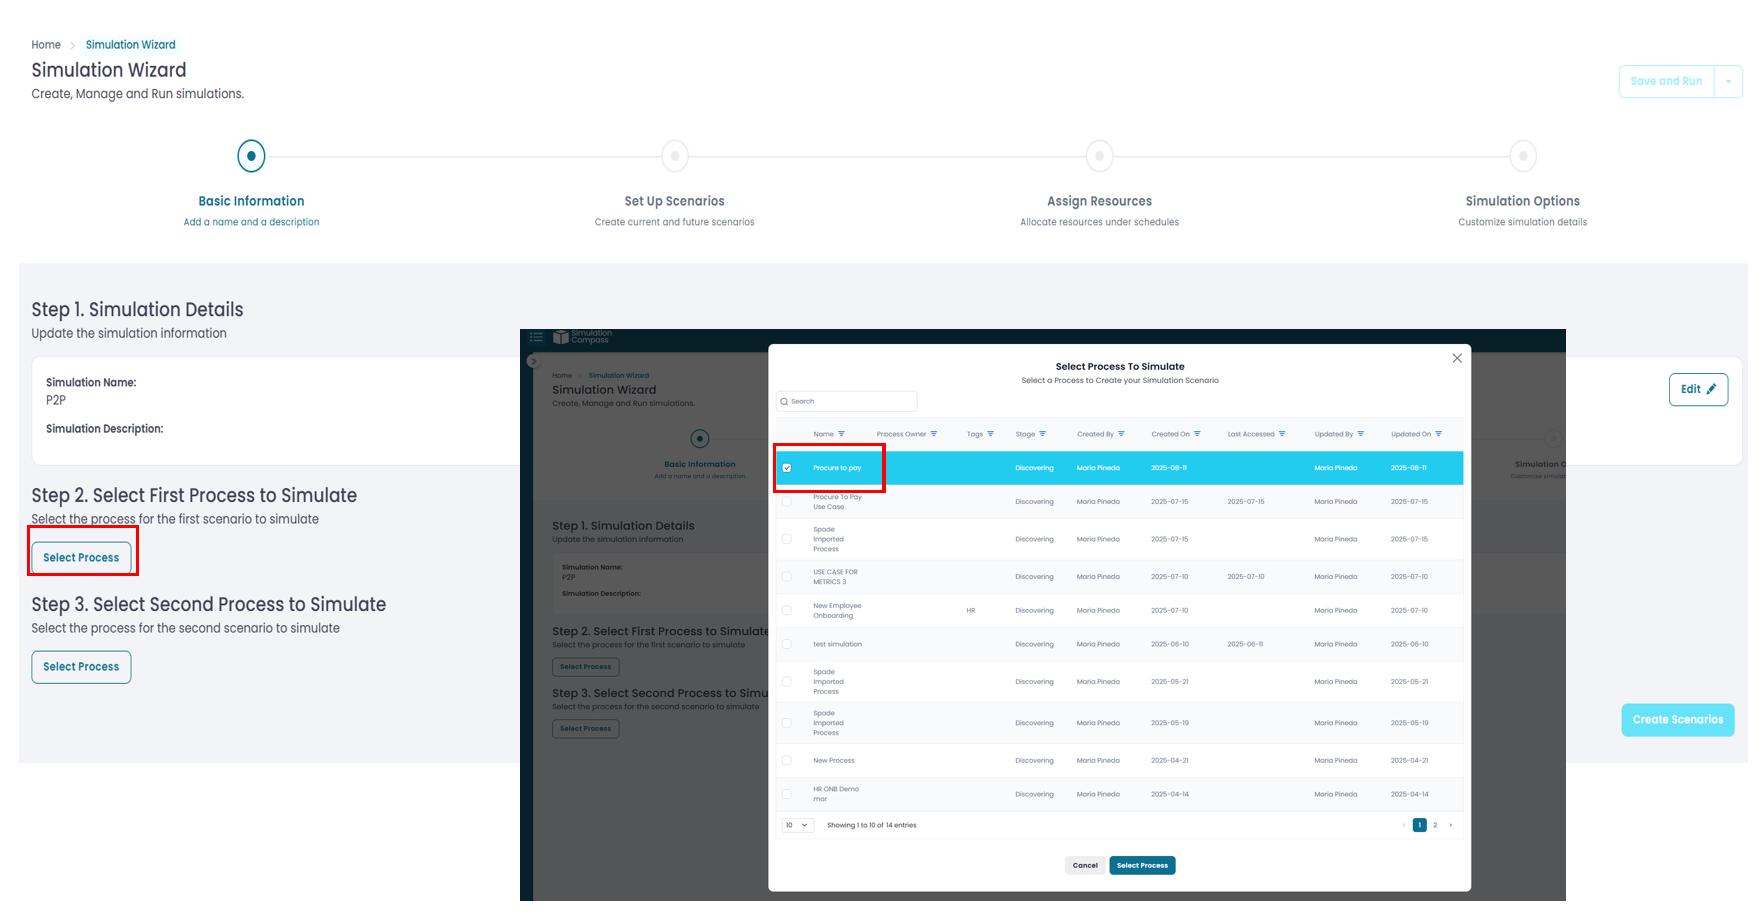
Select As-Is & To-Be (ALWAYS)
Choose both models. For a baseline run, you can select the same process for both.
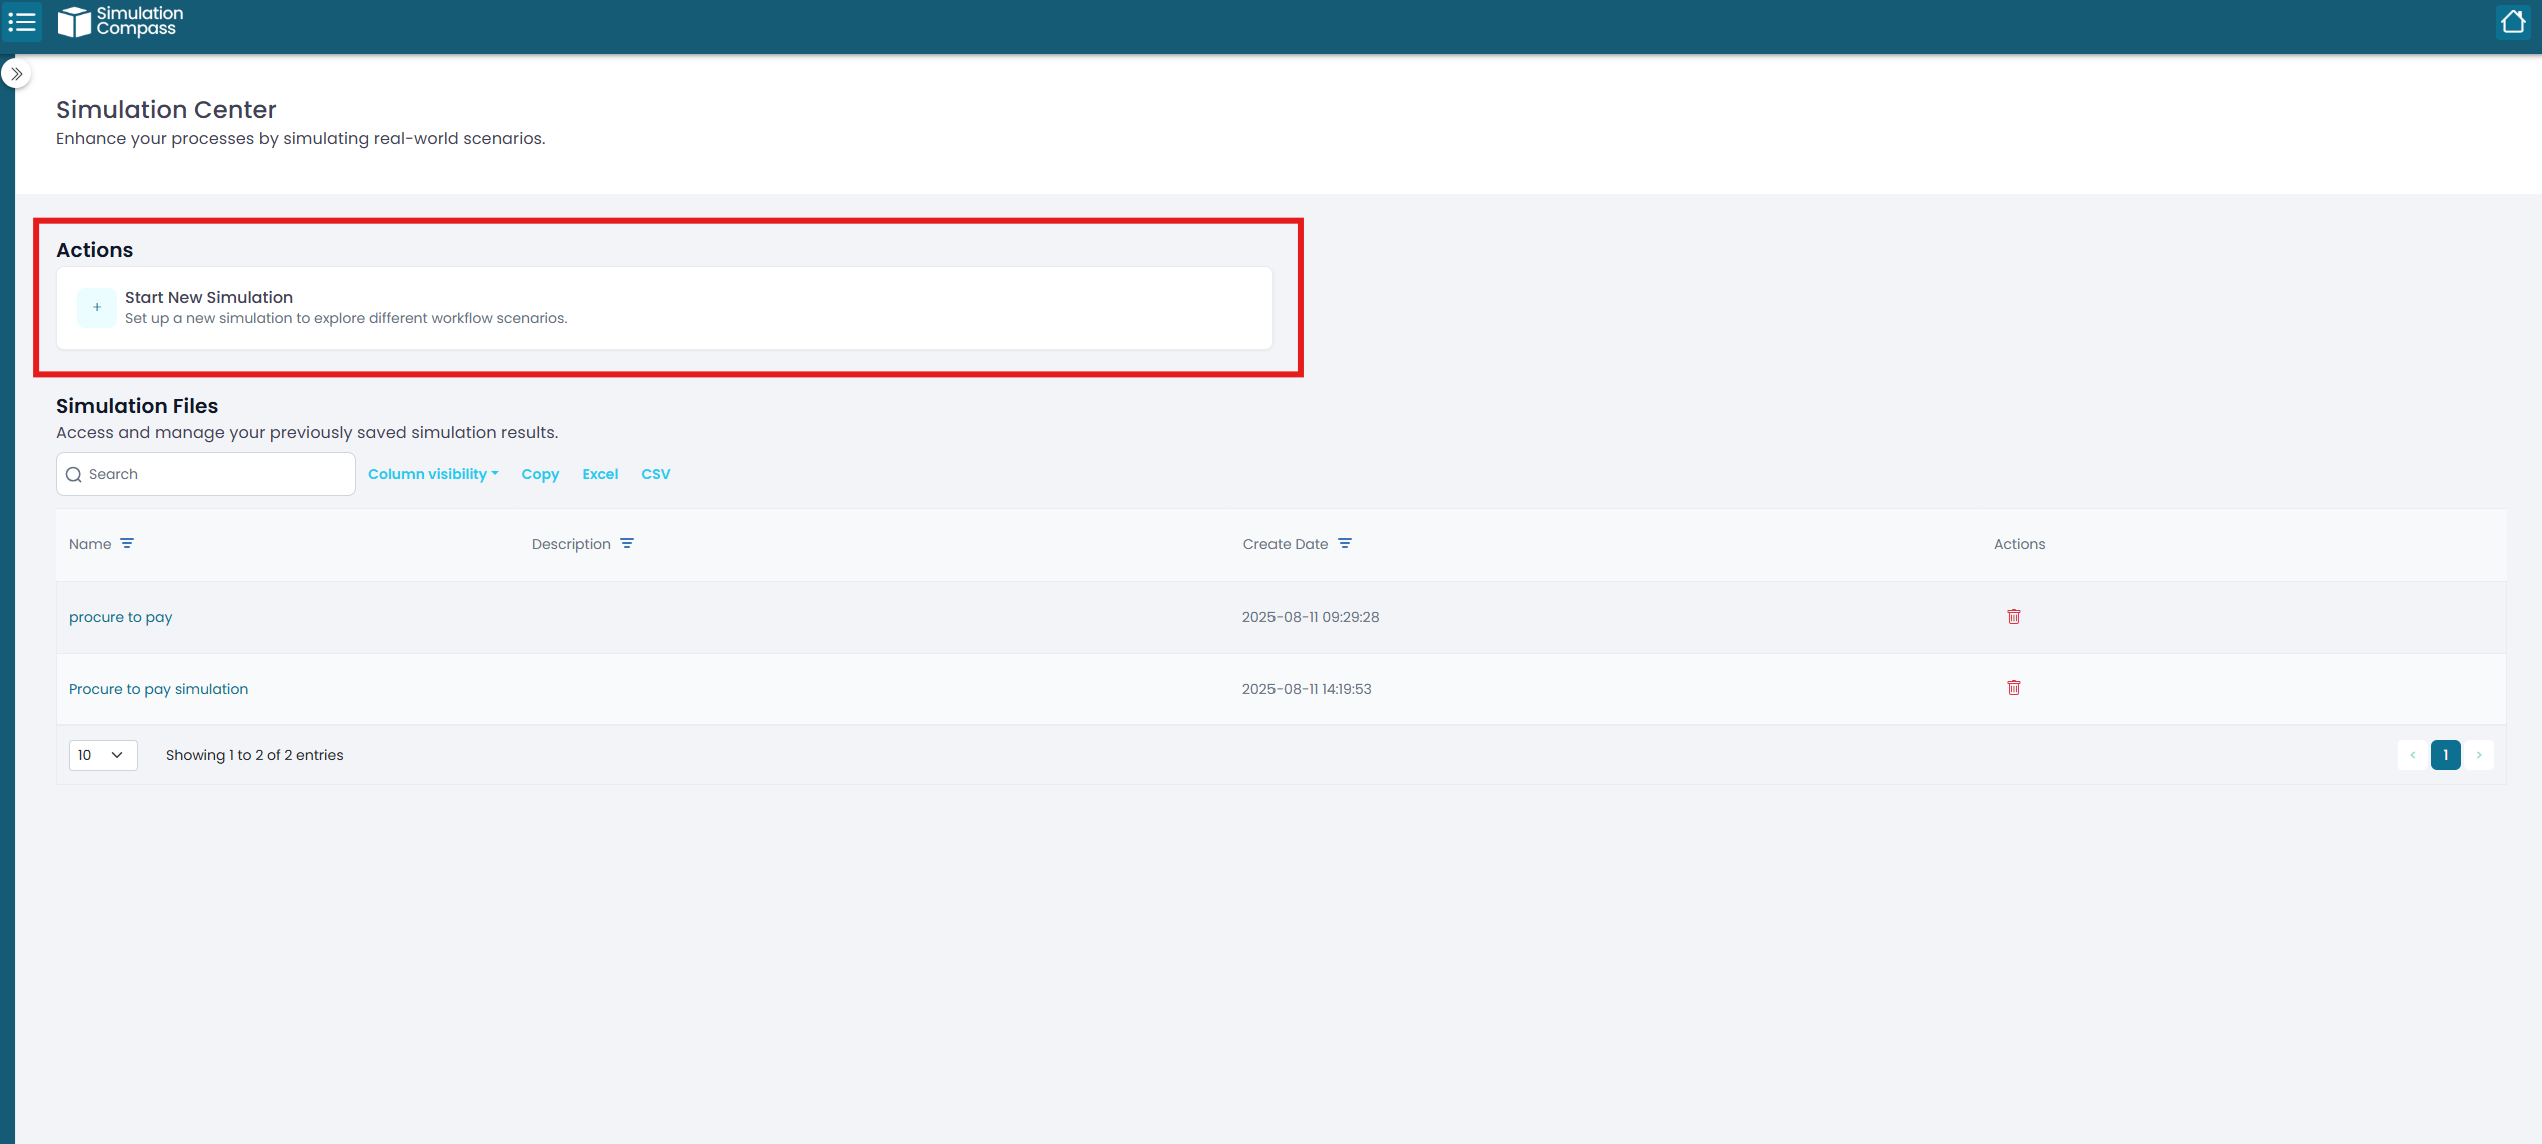
Start new simulation.
For baseline, select the same process for step 2 and 3.
Now you are ready to create your baseline.
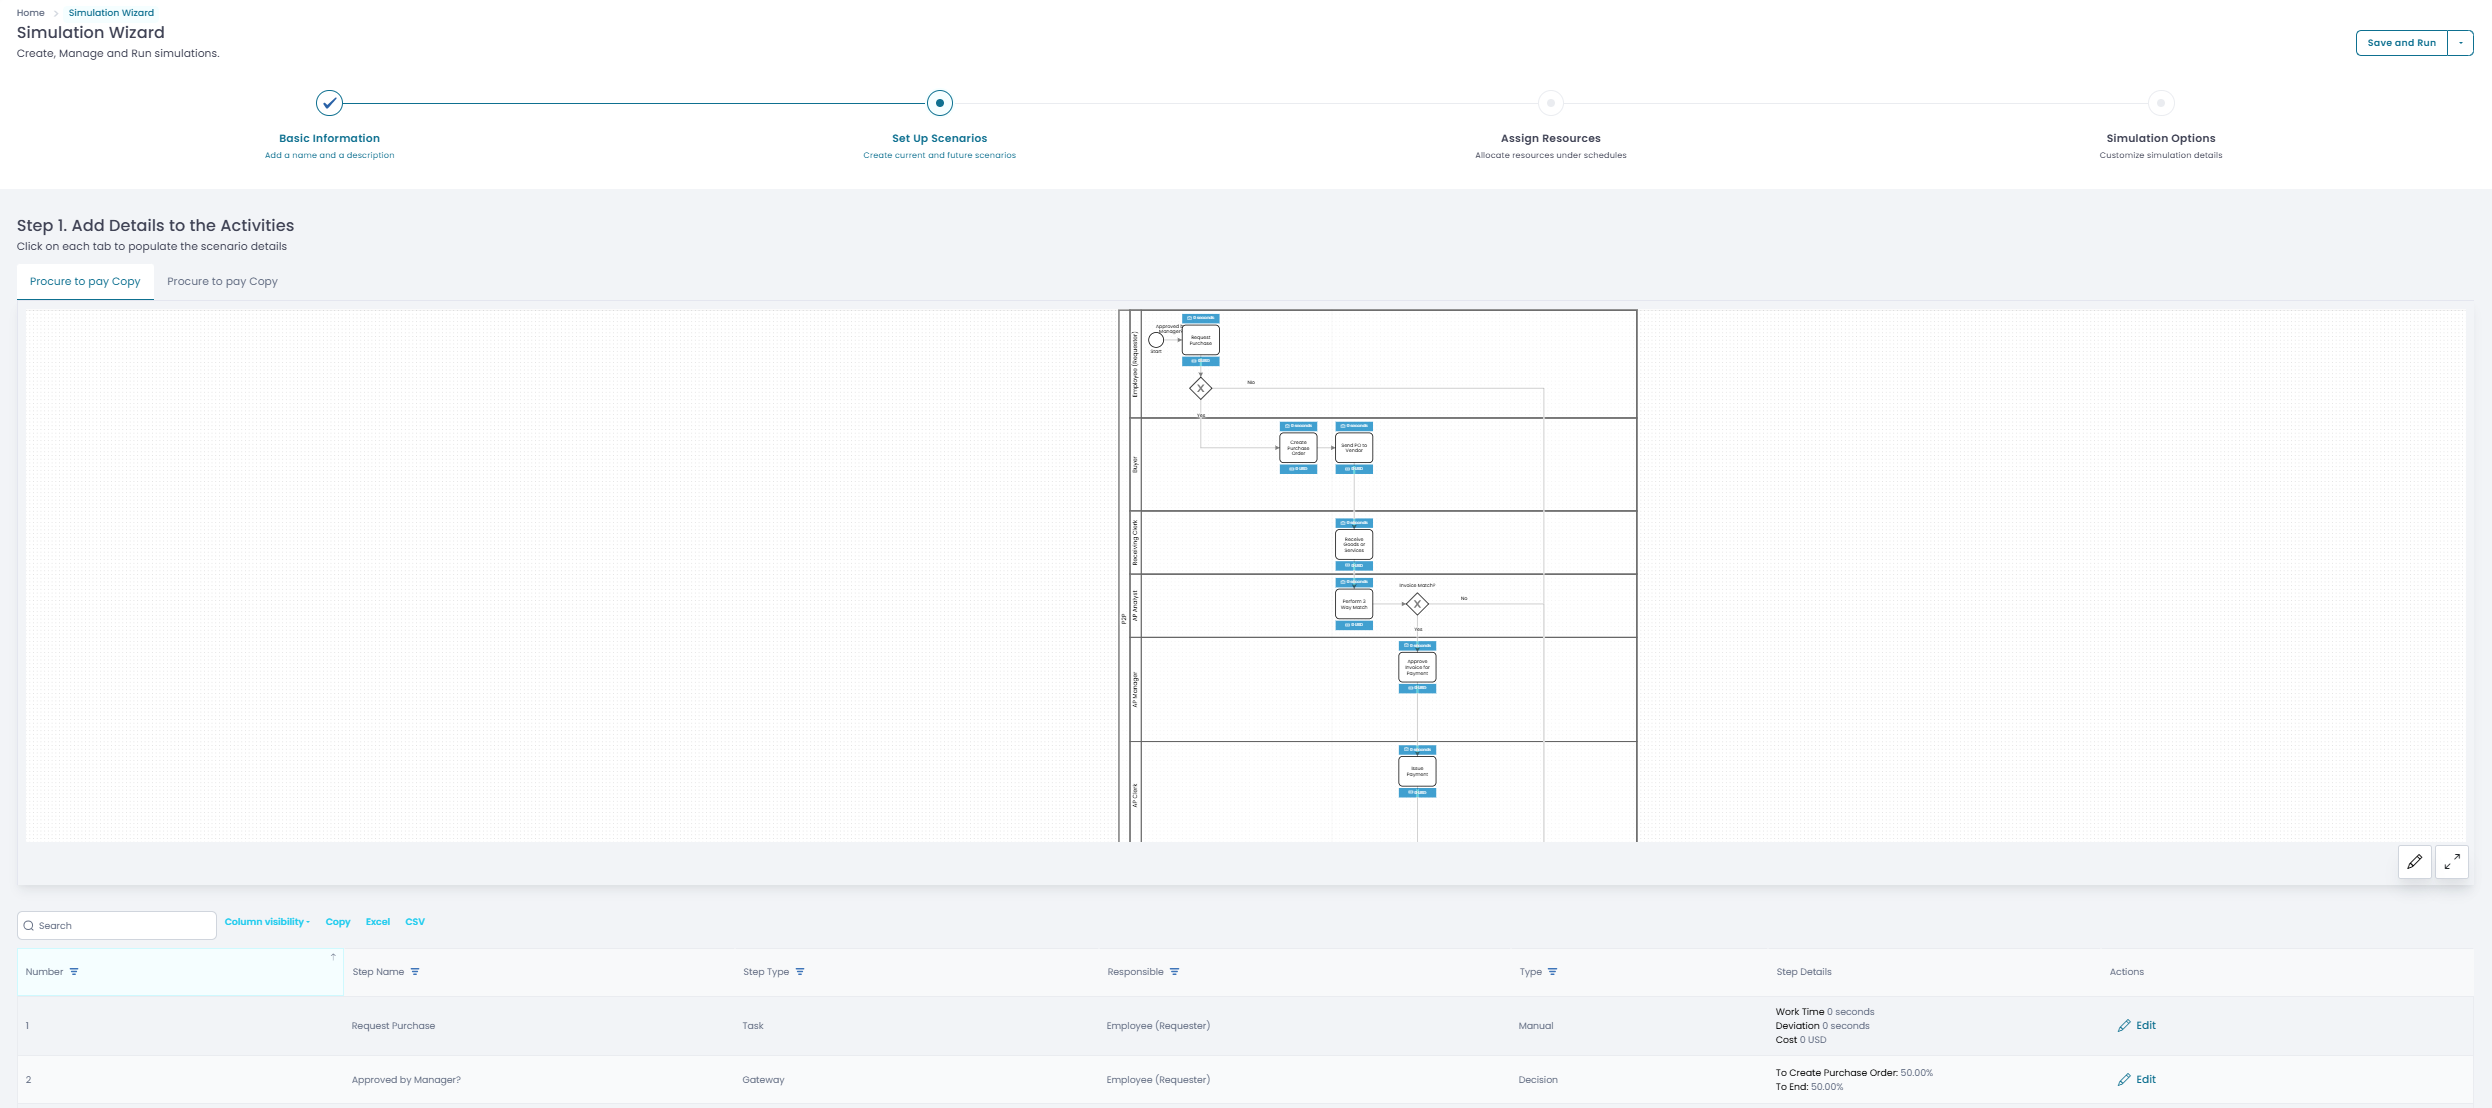
2. Activities & Paths (per scenario)
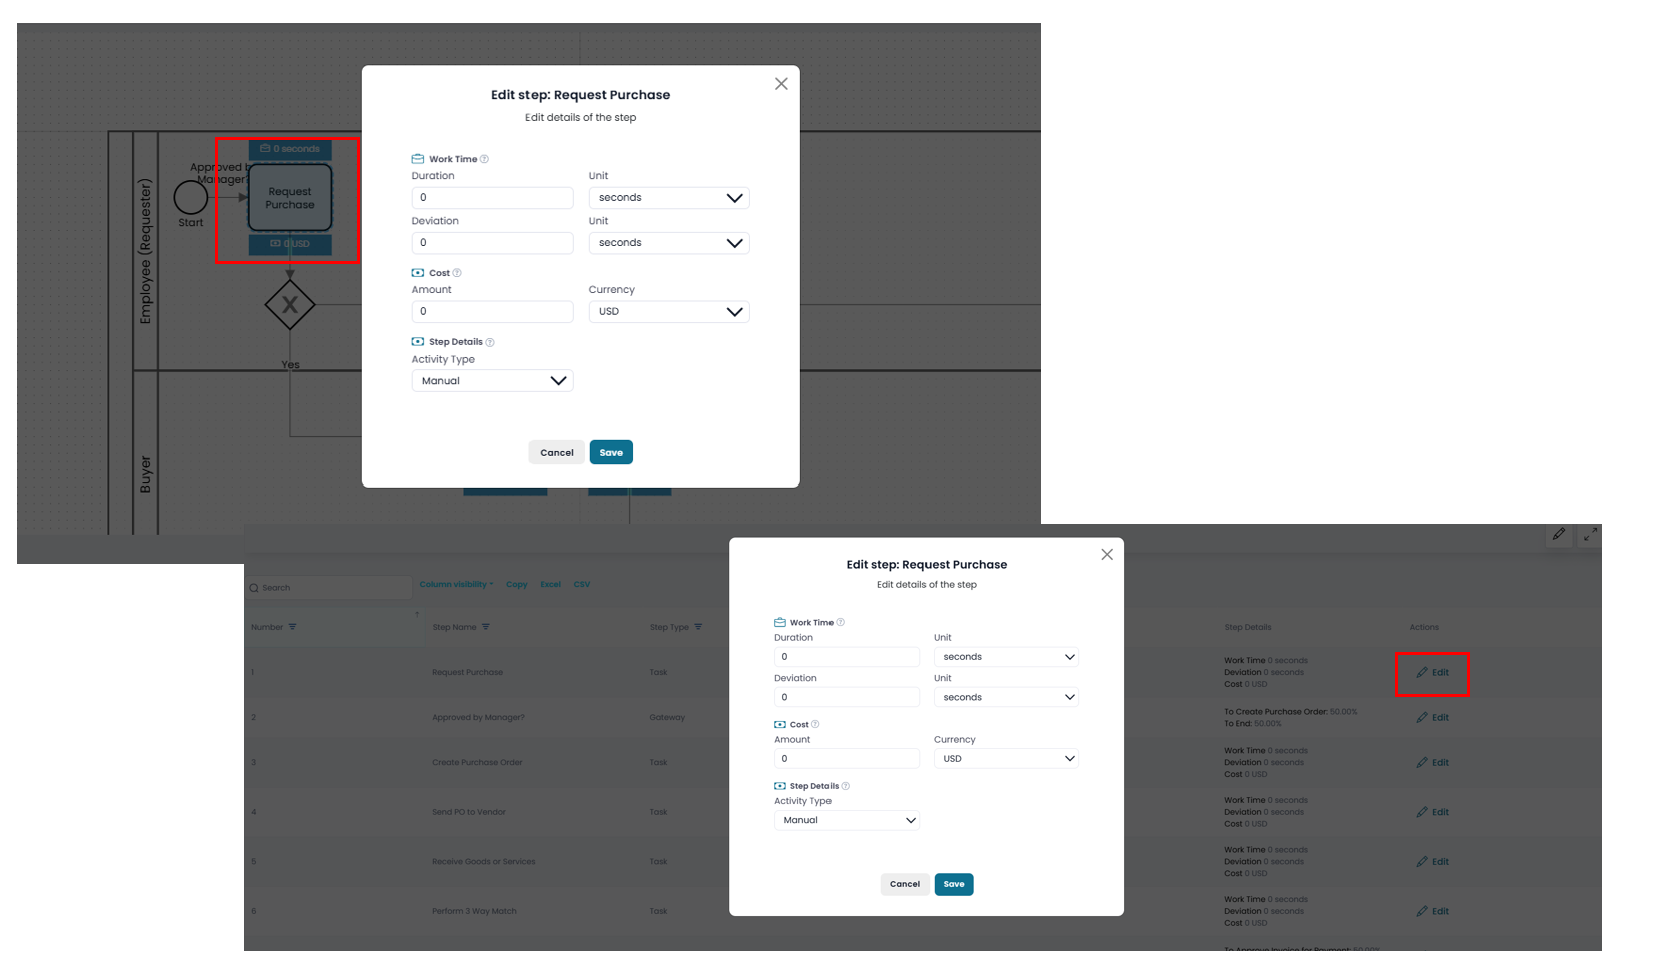
Enter durations for activities.
Add deviations/variability (optional but recommended).
Set percentages for paths at each decision so they total 100%.
Set activity cost per instance.
All the information you provide here will help your model be more accurate.
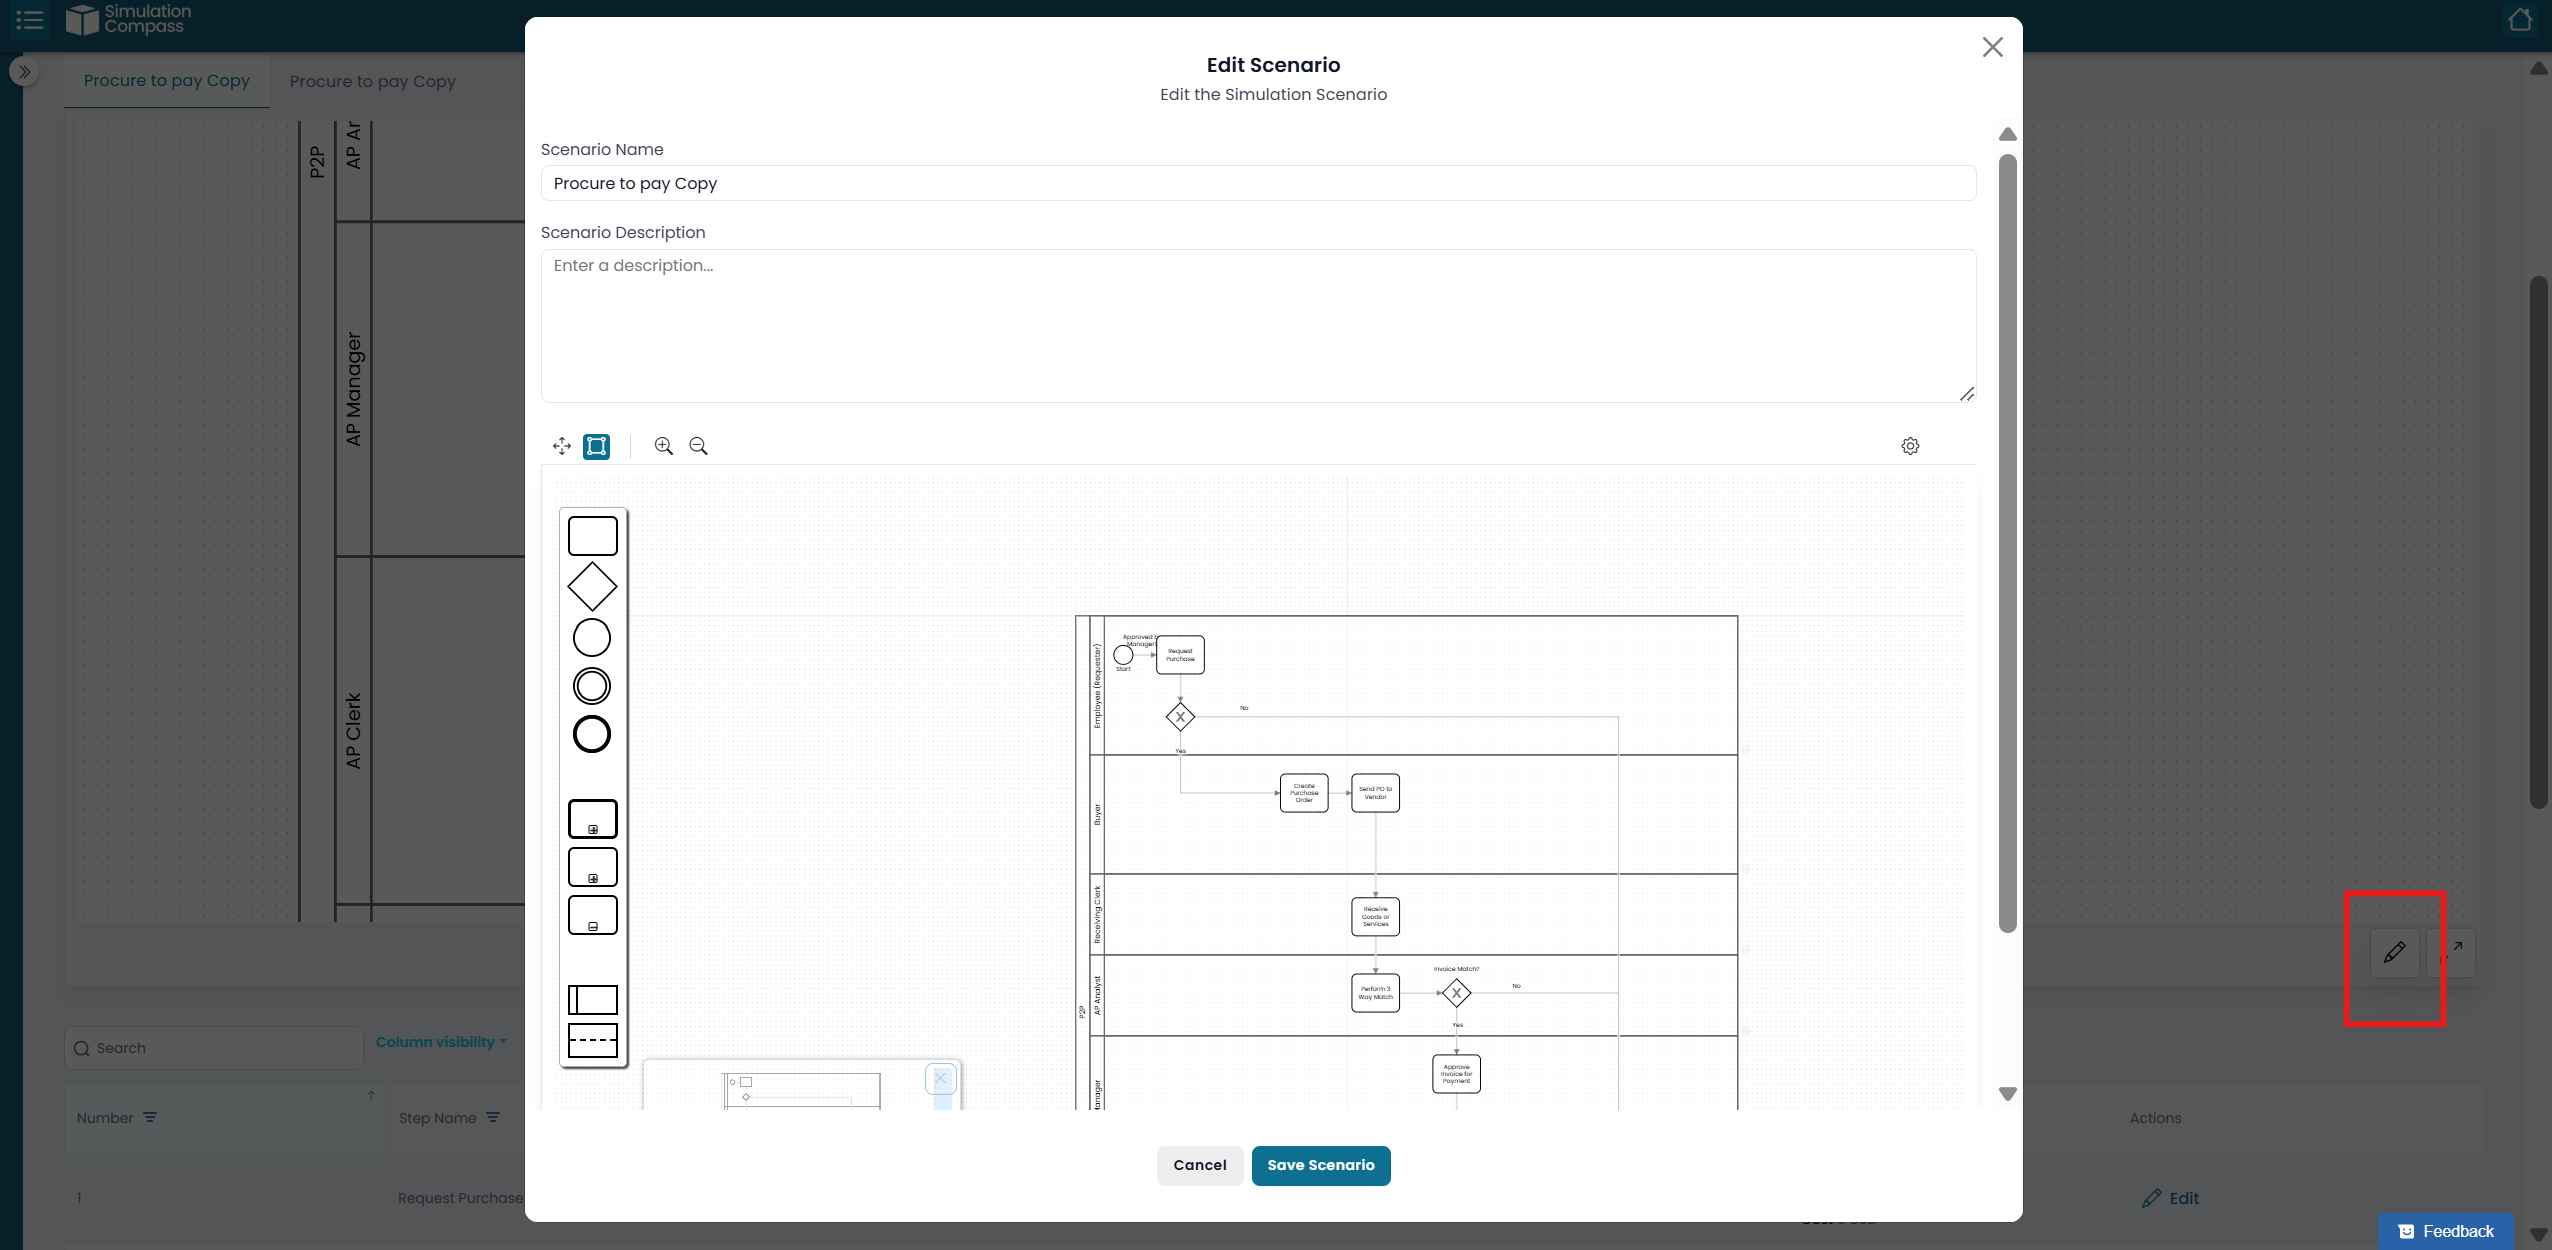
Let's add details to our activities and gateways.
You can add details in two ways: locate the step in the process diagram and click on it, or scroll down to the step list and click Edit in the Actions column.
Note: If you don’t want a process to appear in your Process Model directory as a “to be” version, you can upload the same process directly in the simulation and edit that version instead. Changes made in the simulation will exist only there and will not be saved in your directory. To edit the process, go to the process that would otherwise become the To Be version and click on the Edit icon.
Edit process.
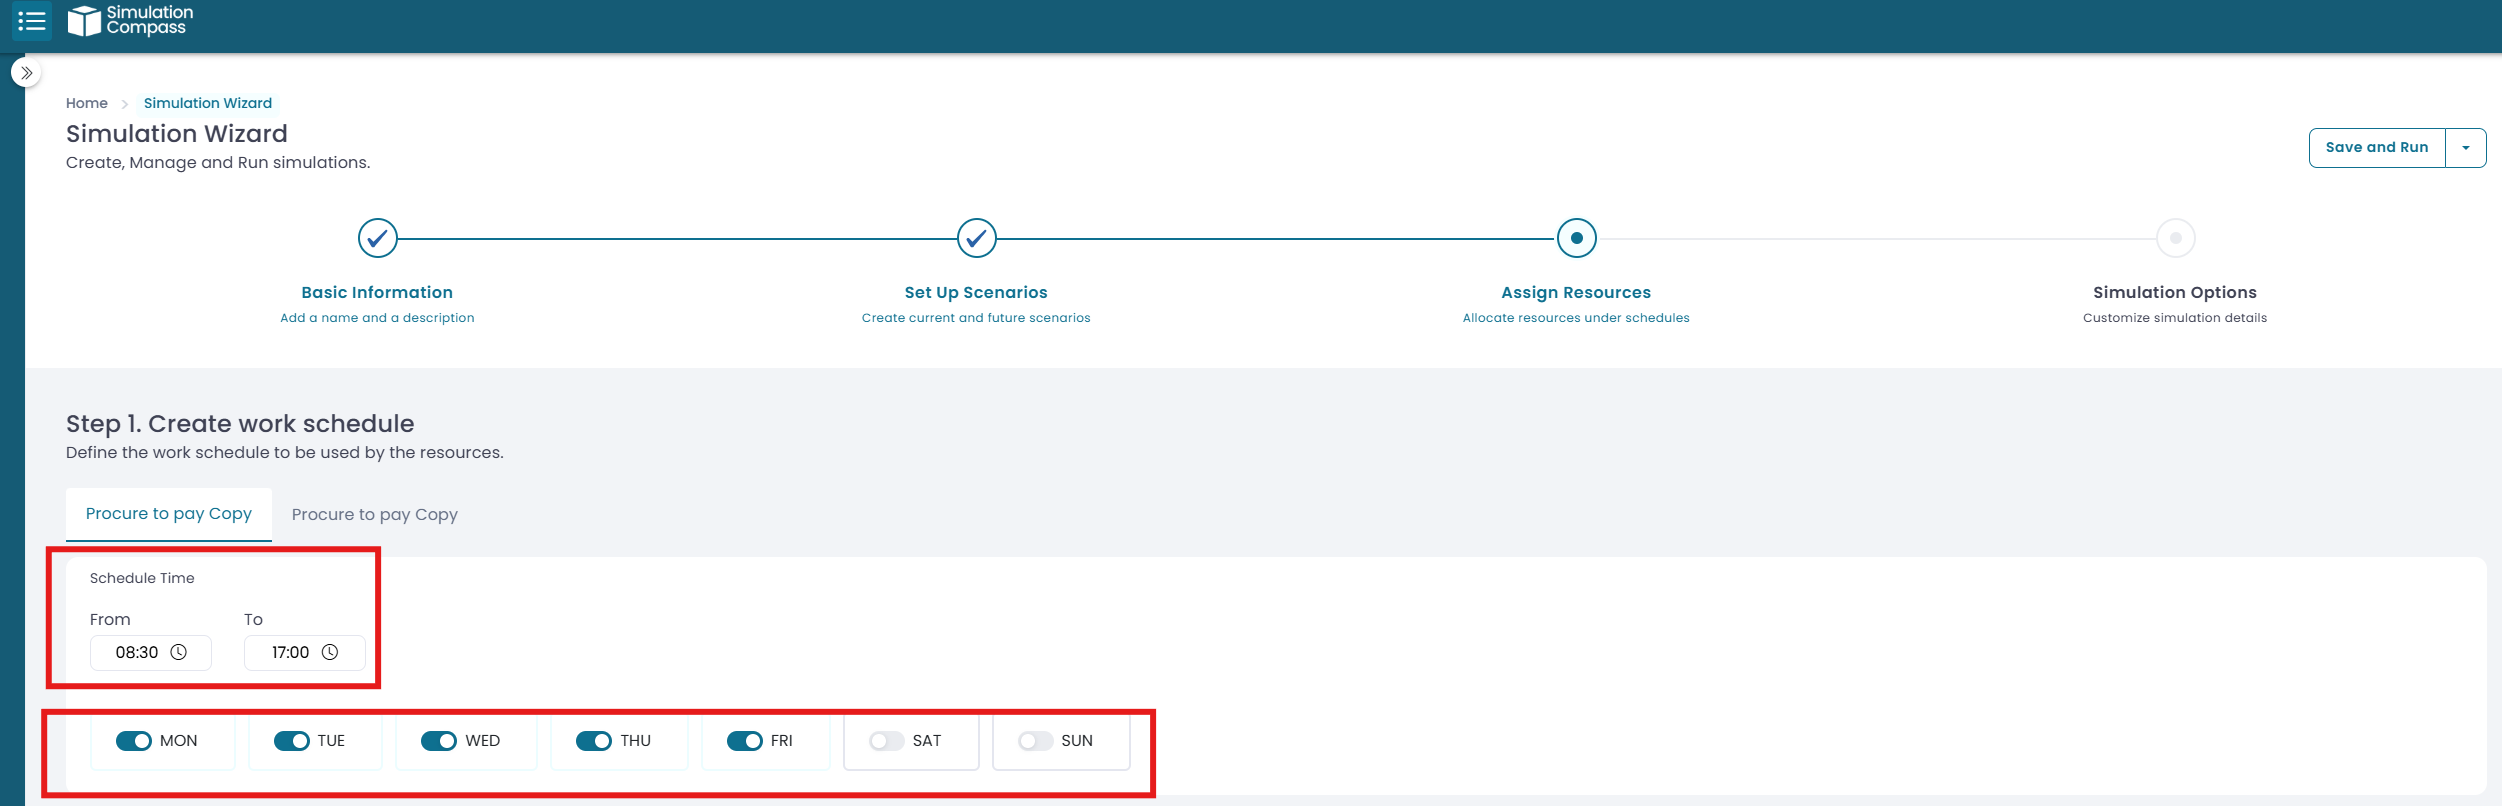
3. Resources
Define schedules.
Set the number of resources per team.
Enter the cost per resource (rate).
Define the work schedule to be used by the resources.
Schedules: Assigning schedules, quantities, and costs. Select if the resource is a system vs. manual resource. System resources do not use schedules.
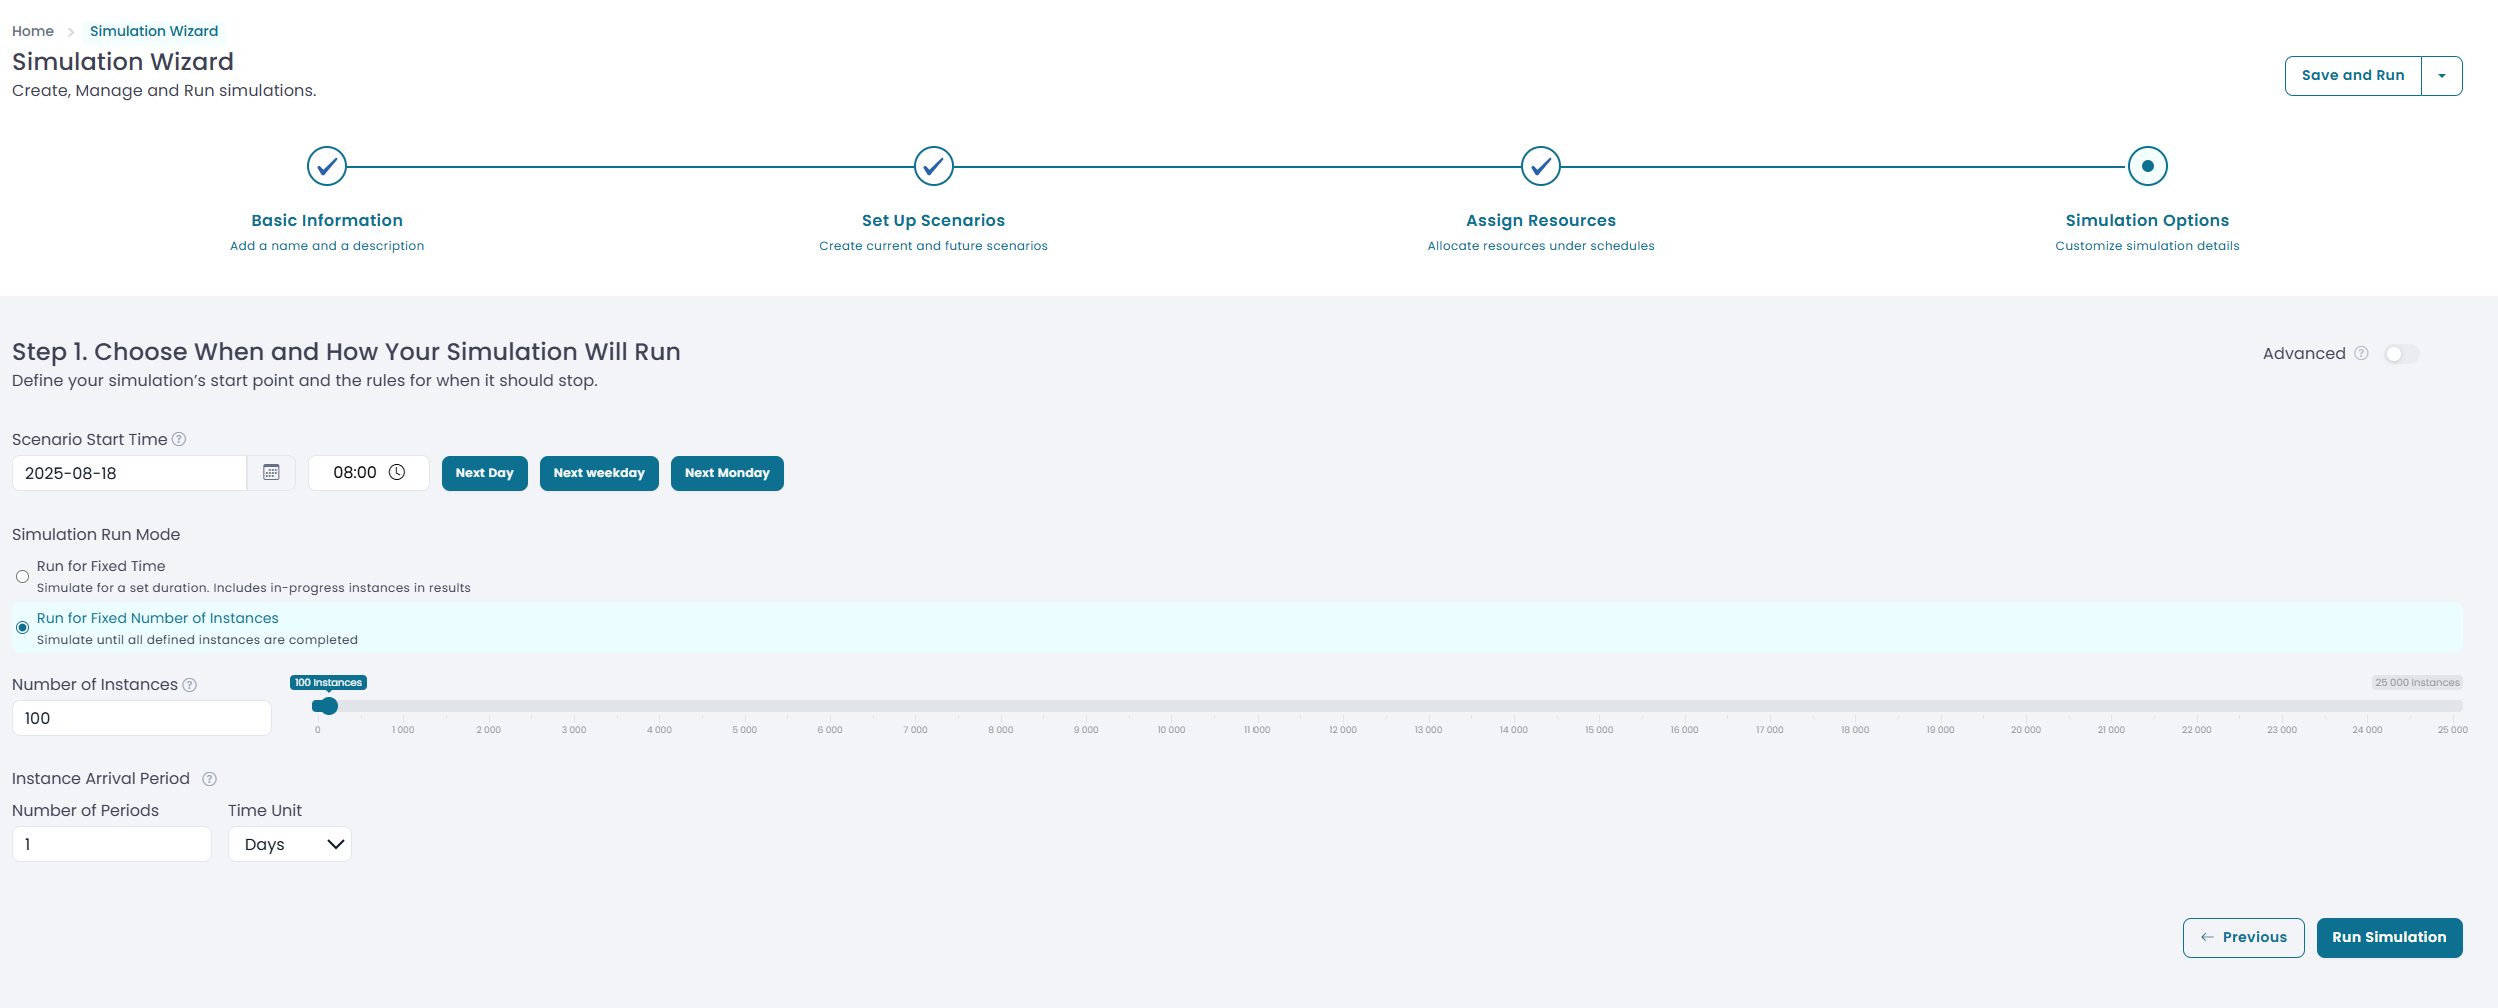
4. Timeframe & Arrivals, then Run
Set the start date.
Enter arrivals (volume).
Define the time horizon (how long to simulate).
Click Run to execute the baseline.
Define your simulation’s start point and the rules for when it should stop.
Process-Level Parameters control how your simulation runs by setting the volume, timing, and pattern of work entering the process. These settings define when and how process instances are generated.
Start Date—When the simulation begins (used for time calculations).
How Your Simulation Runs
Run for Fixed Time – Simulates for a set duration; includes instances still in progress when time ends. Best for capacity, bottleneck, and throughput analysis.
Run for Fixed Number of Instances – Runs until a set number of instances are completed. Best for full lifecycle performance analysis.
Instance Volume- Total number of cases to simulate.
Instance Arrival Period – Duration over which cases arrive.
Period to Simulate – The simulation’s time span.
You can also access Advanced Options by clicking the toggle. This unlocks additional settings that give you more granular control over how your simulation behaves.
Distribution Type for Arrivals: Controls the pattern of instance arrival over the simulation period. Options include uniform and normal distributions.
Distribution Cycle: Defines the repetition pattern of the distribution. For example, a normal distribution over 4 weeks will create a 4-peak workload pattern.
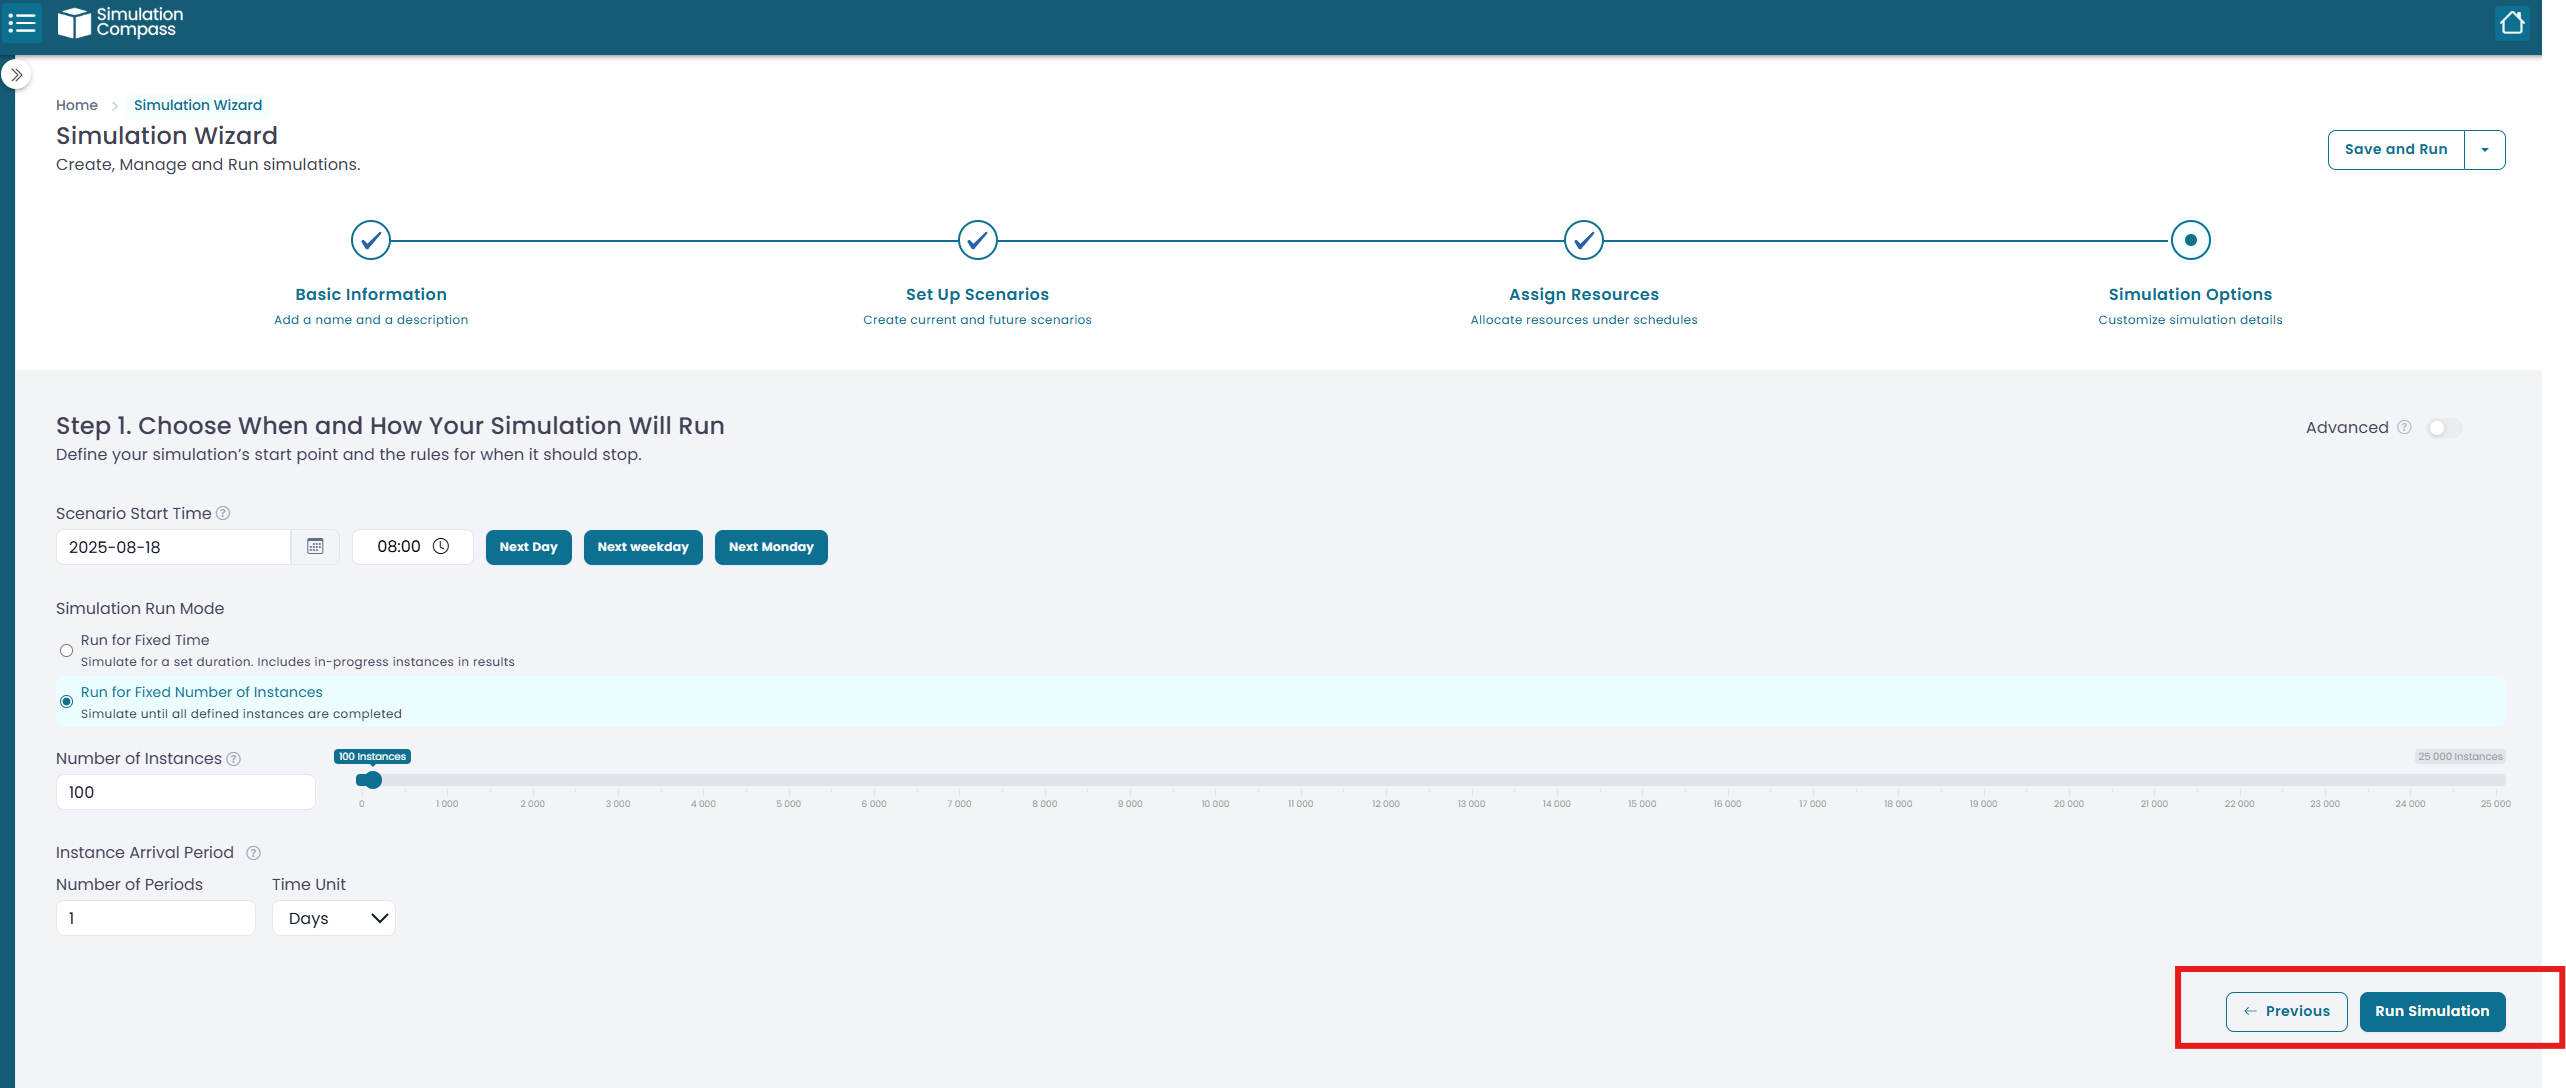
Part 2—Run the simulation
If you followed Step 4 above, your run has started. To rerun after any change, click Run again. (Optional) enable warm‑up trimming if your process has start‑up effects.
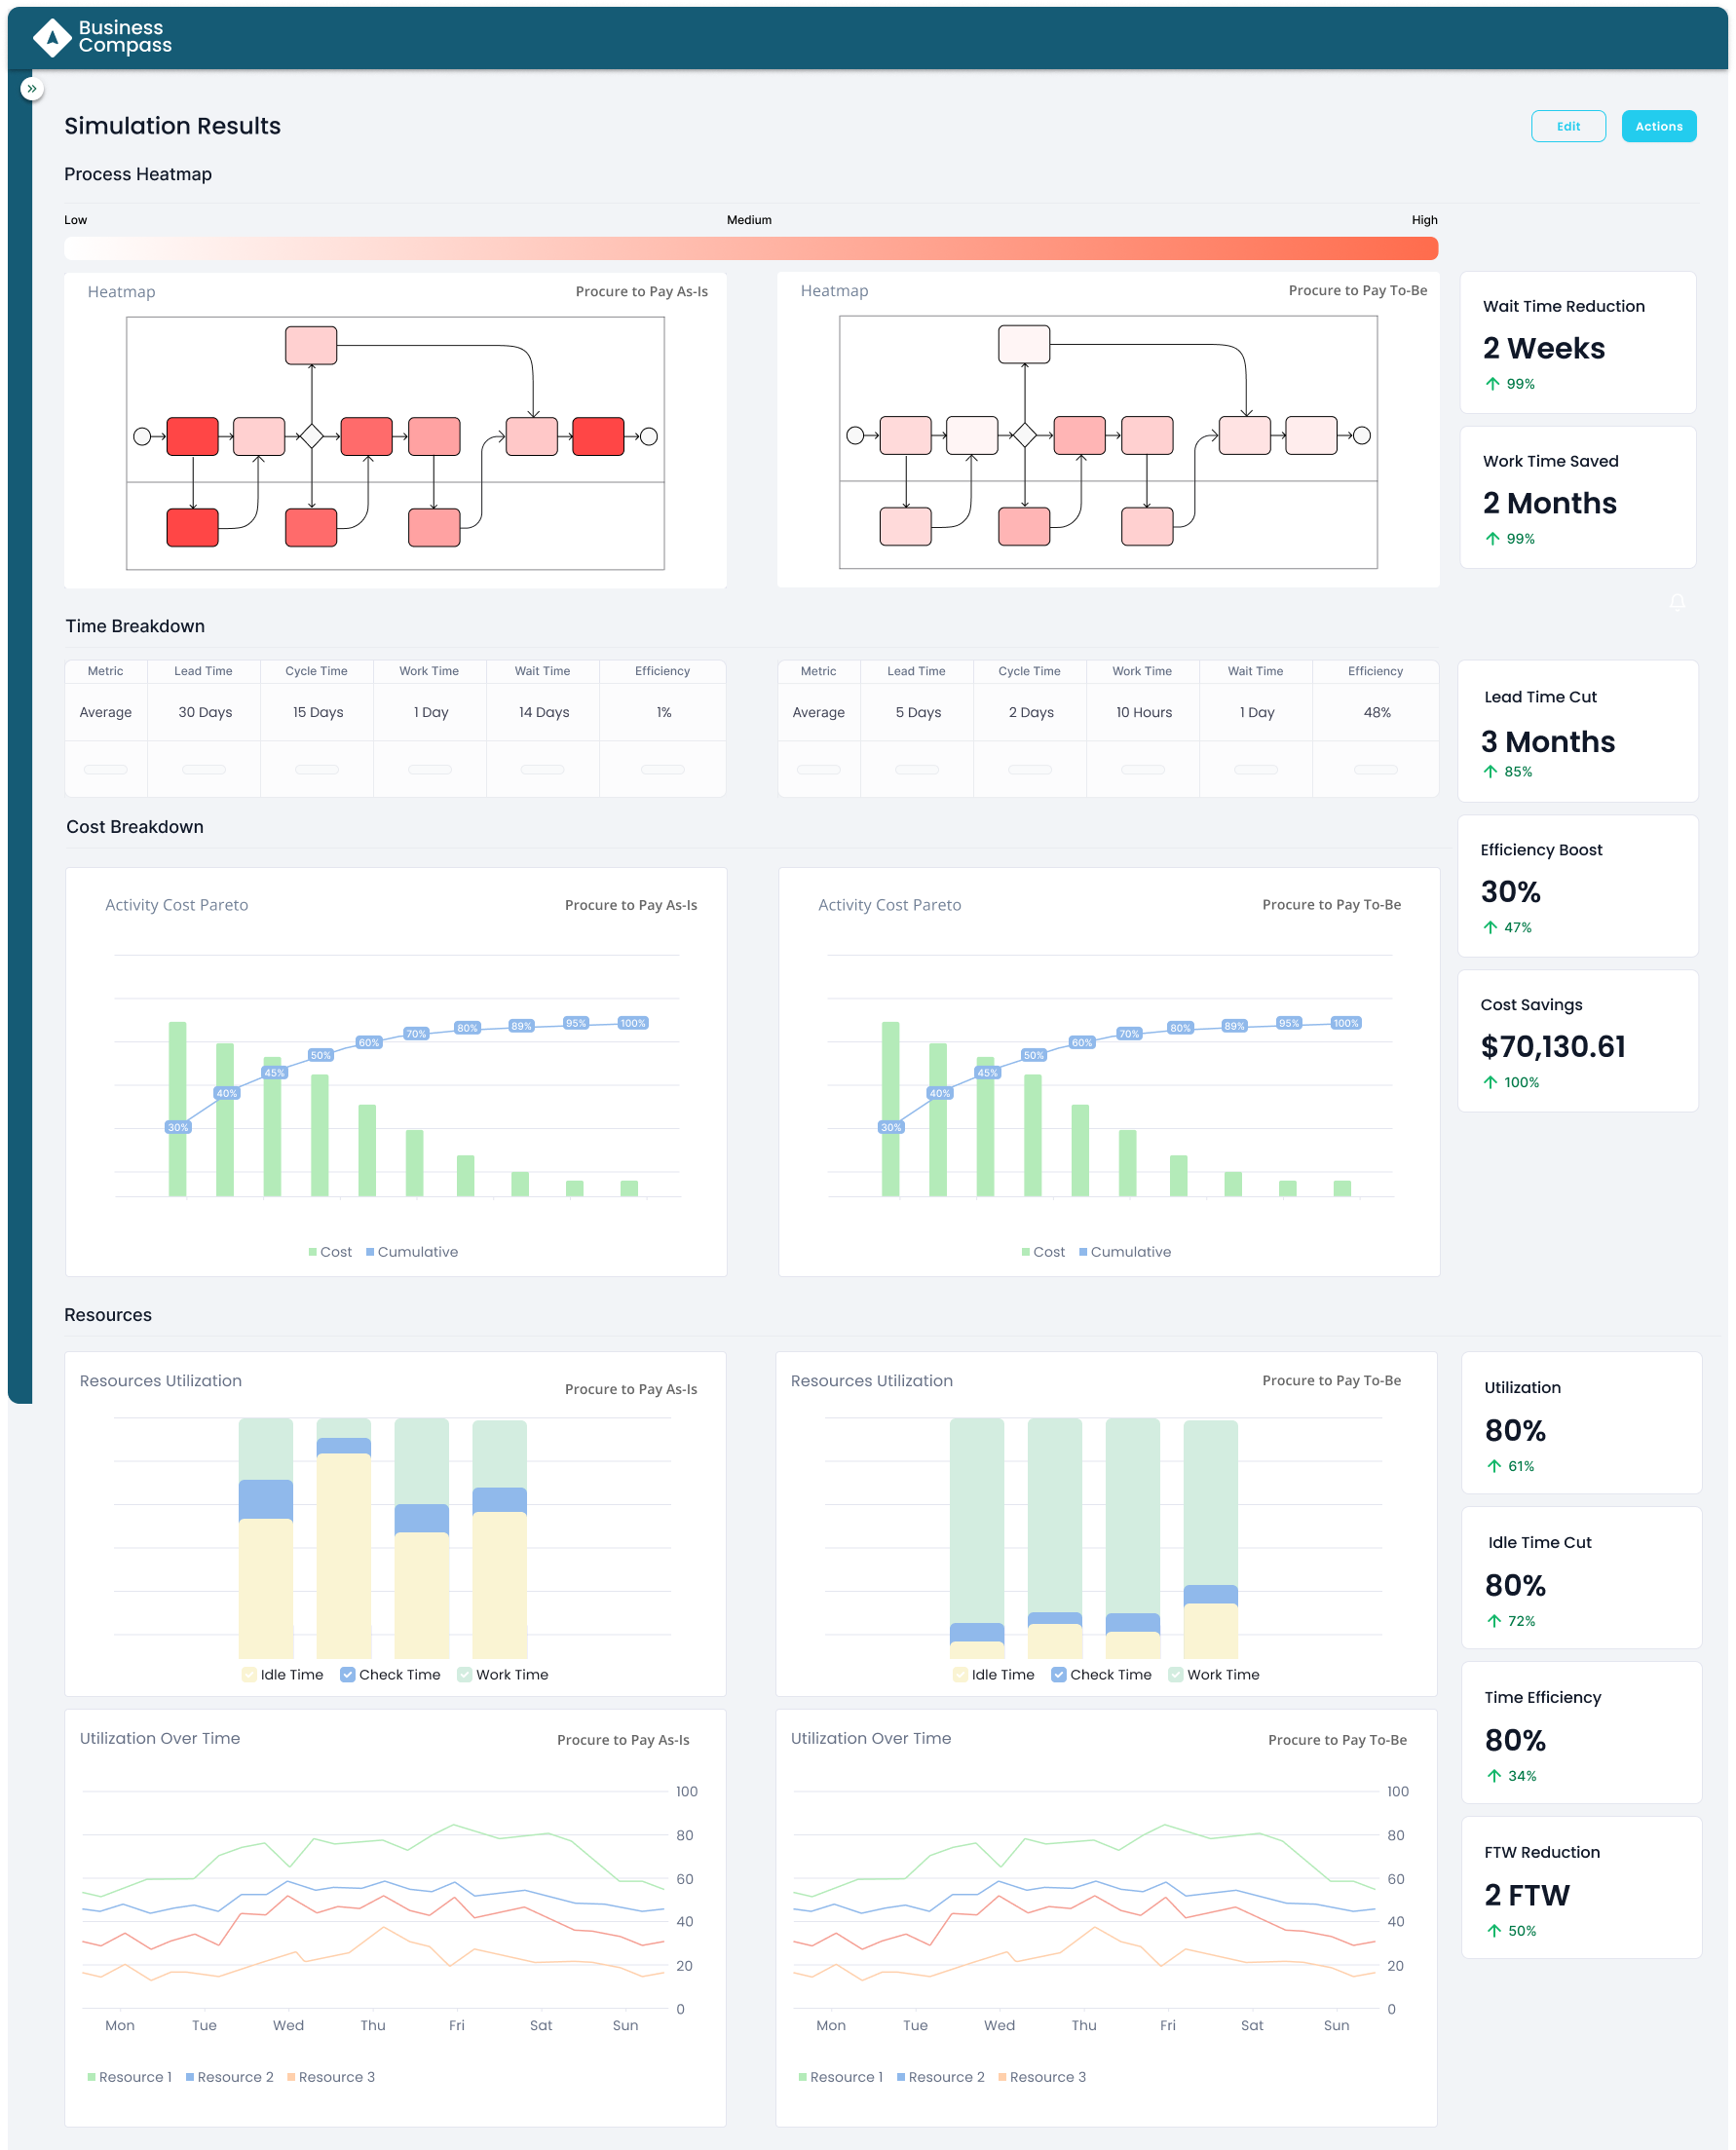
Part 3—Read the results
Overview
Summary KPIs: Cycle time (avg/p50/p90), throughput, total cost, and SLA hit rates (if configured).
Heatmap/Bottlenecks: Visual load on activities, highlighting where queues build up.
Resource view: Utilization by team, capacity vs. demand, and idle time.
Time breakdown: Work time vs. waiting time across the process.
How to interpret quickly
Cycle time high? Check the largest queues first—your bottleneck.
Utilization ~100%? That team is saturated; expect long waits upstream.
Cost spikes? Look at long activities on high‑rate teams; then consider rebalancing or automation.
Want to dive deeper? Explore our use case to see firsthand how simulation can transform your understanding and decision-making.
Stop Guessing. Start Knowing.
Every day you wait is another day that six-figure savings stay hidden in your processes. Take the first step.